Prepared by: RESIDENT.NGO ThreatLab
Incident Period: May 12–26, 2026
Publication Date: June 16, 2026
Classification: Distributed Denial of Service (DDoS) Attack — Layer 7 (HTTP Flood), multi-wave
TL;DR
Between May 12 and 26, 2026, a key website for the elections to the Coordination Council — the main body of Belarus’s democratic forces, which operates in exile — was hit by a sustained flood of fake web traffic designed to knock it offline. Importantly, this website (nbgov.org) was the election’s information and sign-in service, not the system where ballots were actually cast and counted; according to the platform’s technical lead, the voting itself ran on a separate, third-party voting system. The attack came in seven waves and was very large: the part of the site we examined absorbed roughly 3.4 billion junk requests, and the election’s organisers put the total across the whole election platform at around 24 billion.
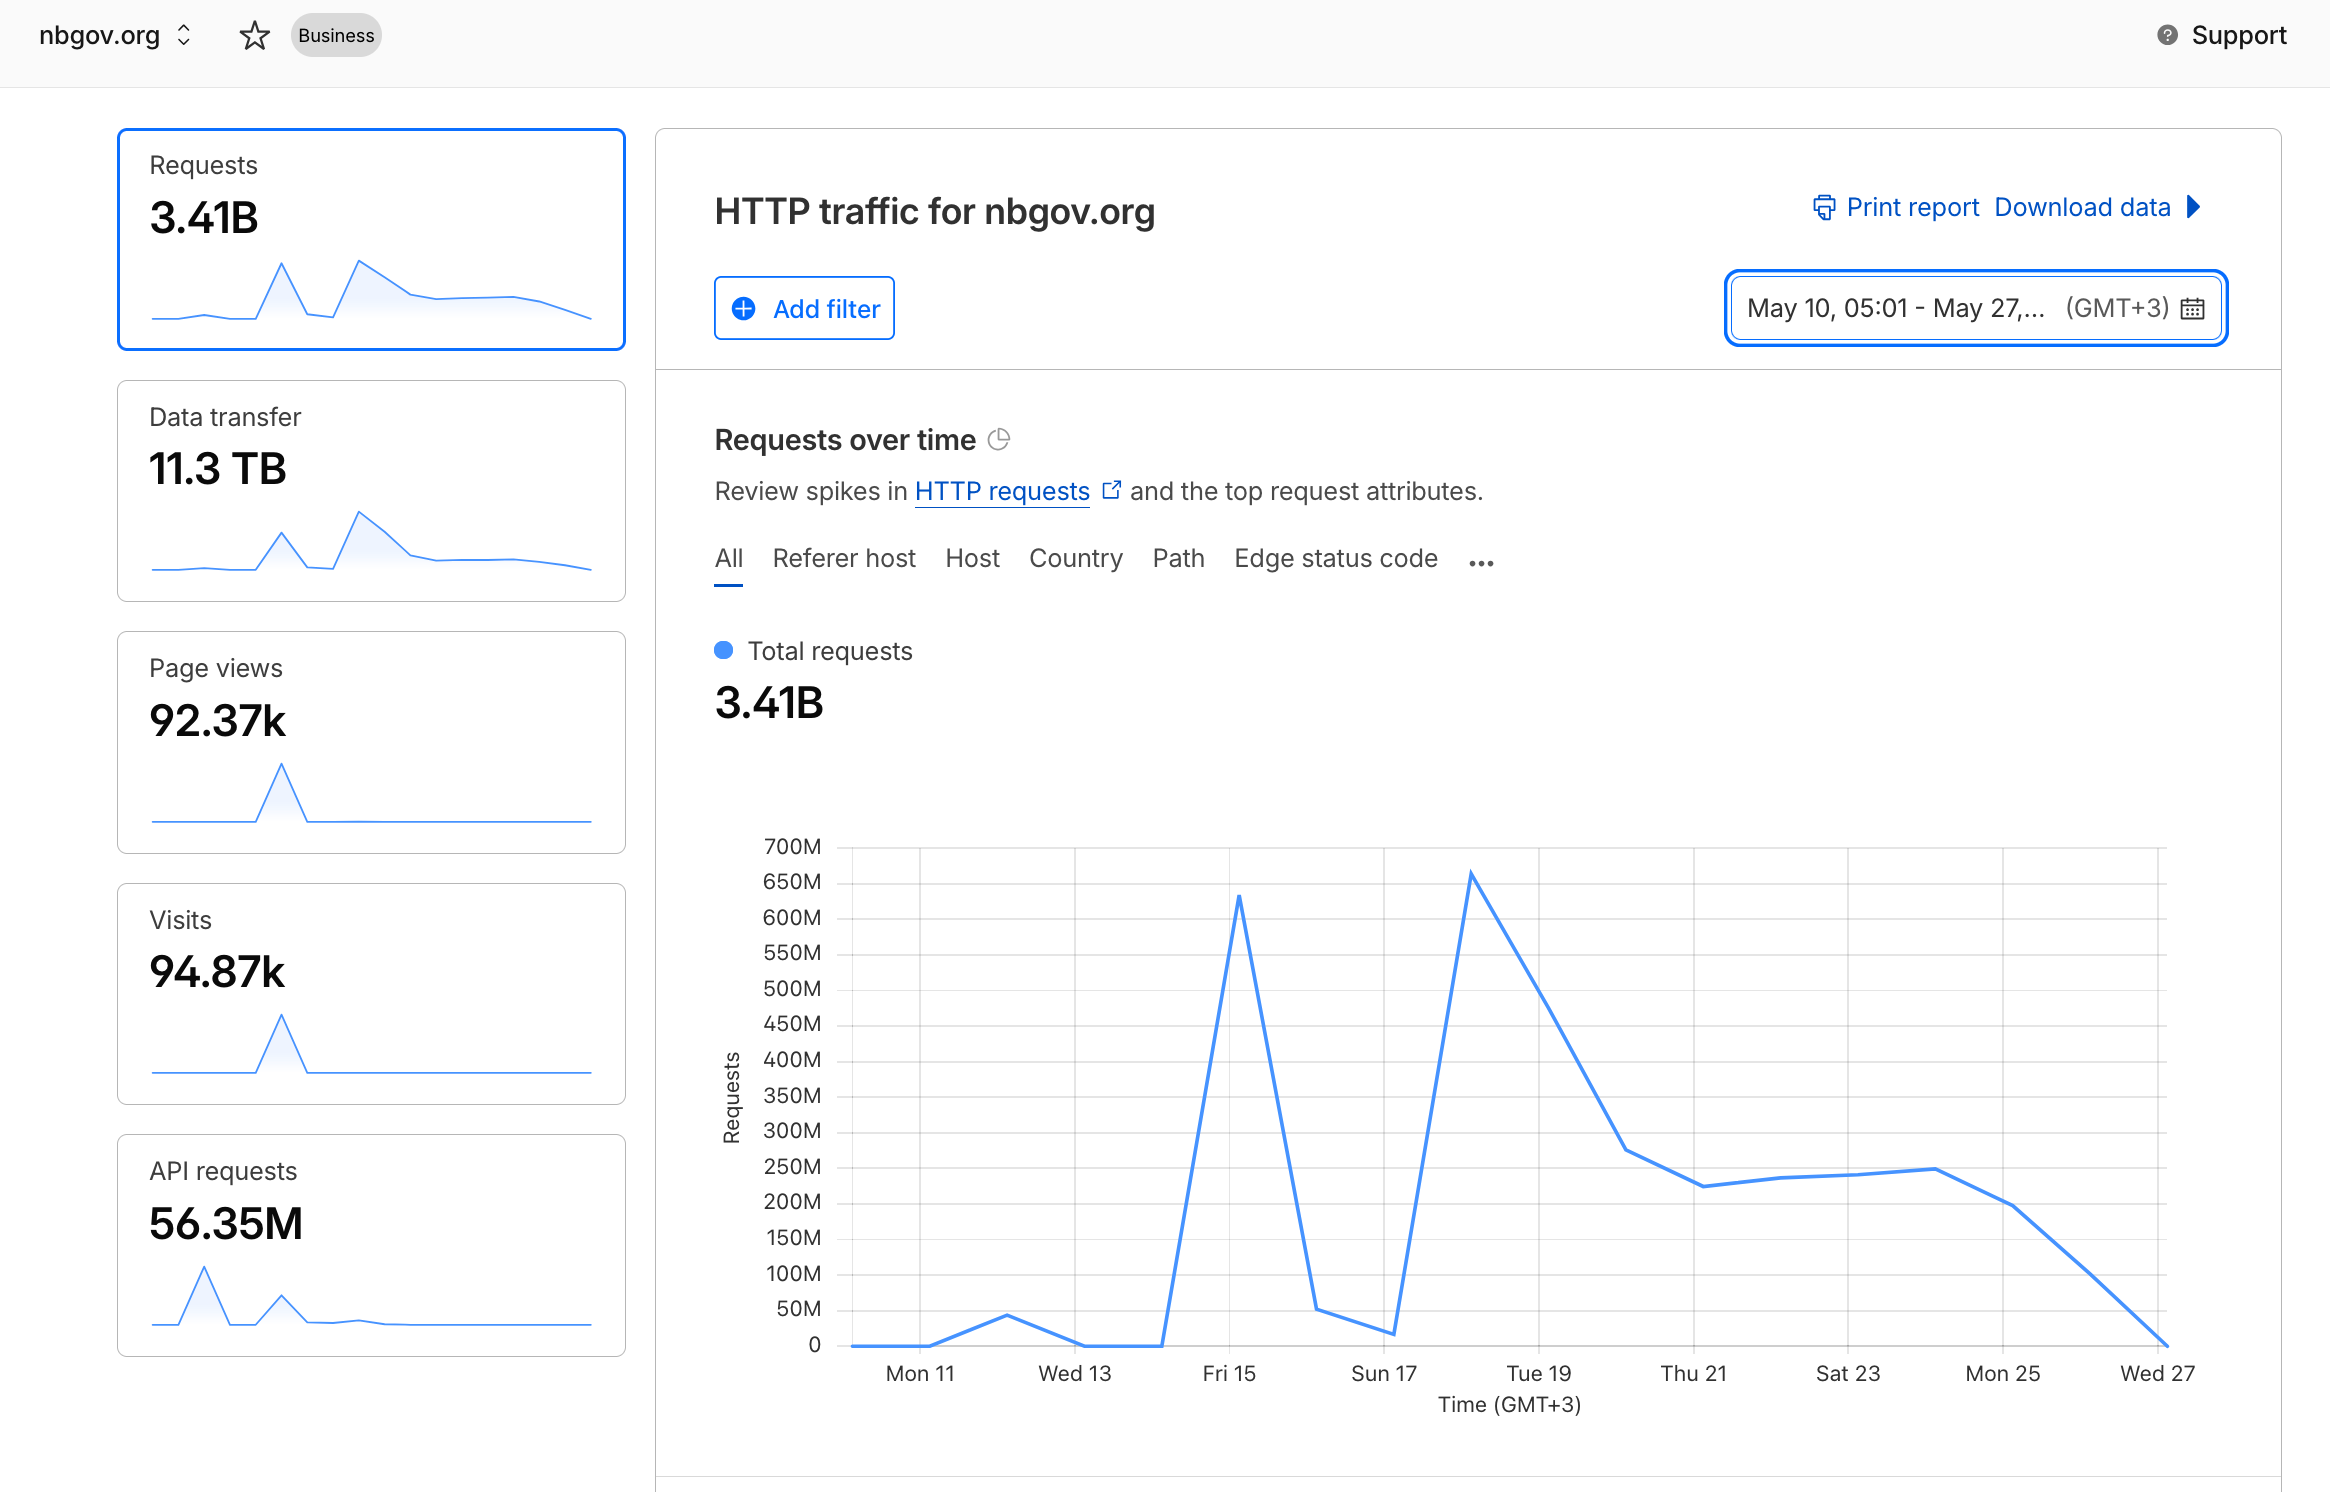
The protection service in front of the site, Cloudflare, blocked or absorbed the overwhelming majority of the flood, and during the single biggest wave the site’s own back-end server was barely touched. But the protection was not perfect: the very first wave, on May 12, mostly slipped through to the server, and the May 15 wave was intense enough to make the information and sign-in services slow or temporarily unreachable for some real users. There is no evidence of a break-in, stolen data, malicious software, or lasting damage — this was an attack on availability (keeping the site reachable), not an intrusion. It did not, and could not, change whether votes were recorded or counted correctly, because the ballots themselves were handled by a separate voting system, not by this website. Some of the same high-volume attack machines also appear in earlier attacks on another Belarusian outlet, pozirk.online — though that overlap is limited to two of this campaign’s seven waves, not the campaign as a whole — and the timing lines up closely with the election. Who ordered or paid for the attack, though, remains a reasoned suspicion, not a proven fact.
Scope note: this analysis looks at one website only — nbgov.org and its sub-services — using the data from the single protection provider in front of it. The wider 2026 election ran on more than this one site, and other sites and services were attacked during the same period. Those other targets, and any traffic handled by other providers, are outside this report. Every figure here describes this one domain.
Who was attacked
nbgov.org was the election’s official information and sign-in website for the May 2026 elections to the Coordination Council, a representative body of Belarus’s democratic movement. It is where people went to read about the election and to verify their identity before voting. The ballots themselves were cast and counted on a separate, third-party voting system — so nbgov.org was the public-facing front door to the election, not the vote-counting machinery behind it. Because the movement operates largely in exile, and in-person voting inside Belarus is unsafe for many people, this online process is effectively the only way these elections can happen, which makes the front-door website a natural target: knock it offline and you make it harder for people to reach the vote at all. Voting ran from May 11 to 19 — extended from an original May 11–17 window, partly to make up for the disruption the attacks caused — and the waves analysed here fall within and just after that period.
What kind of attack this was
This was a Distributed Denial-of-Service (DDoS) attack — specifically an “HTTP flood.” In plain terms, the attackers used a large number of computers spread across the internet to send a huge volume of ordinary-looking web requests all at once, trying to overwhelm the site so genuine visitors can’t get through. The aim is not to get inside; it is to exhaust the site until it slows down or stops responding.
What this does not mean: there is no evidence that anyone broke into the site, stole data, installed malicious software, or damaged the servers. The attackers never got inside — they tried to bury the site under traffic. And because the ballots themselves were cast and counted on a separate, third-party voting system rather than on nbgov.org, the integrity of the vote — whether ballots were recorded and counted correctly — was not something this attack could reach.
What happened
The platform sits behind Cloudflare, a service that acts as a shield in front of a website. Every incoming request reaches Cloudflare’s global network first — its “edge” — which decides whether to pass the request back to the site’s own server (the “origin”) or block it. A good shield stops the junk at the edge, so the origin server never feels most of it.
The attack arrived in seven waves over two weeks. Most were short, sharp bursts; the last was a continuous eight-day flood.
The first wave, on May 12, was the one the shield handled worst. Most of that traffic was malformed in a way that slipped past the filters and reached the server. The server rejected it, but in a small share of cases it failed under the strain.
The largest burst came on May 15: hundreds of millions of requests in about four hours, peaking near 161,000 requests every second. Cloudflare blocked most of it, but enough broke through that the server was intermittently overwhelmed — for stretches it could not accept new connections or returned errors. In practice, some real users would have found the information or sign-in service slow or briefly unavailable during those peaks. (We cannot perfectly separate how much of the traffic that reached the voting-access page was genuine users versus attack traffic, but the attack vastly outnumbered normal use.)
The longest wave ran from May 18 to 26 — roughly 2.7 billion requests over eight days, aimed at the sign-in/identity service. Here the shield held almost completely: the back-end server was contacted for only about one in every thousand of those requests. Alongside the flood, this wave also probed the site for common break-in points — login pages, admin pages, and exposed configuration or password files — but the security rules caught those probes. Probing is not the same as getting in, and there is no evidence any of it succeeded.
Technically, the campaign appears to have used at least two different attack tools: the earlier waves came mostly from residential and mobile internet connections, while the final eight-day wave ran mainly from rented hosting infrastructure.
Who might be behind it
The timing is hard to ignore. The attacks tracked the election closely: they began as voting was due to launch and continued through and beyond the voting window. The clear practical effect was to make it harder for Belarusians to take part. On that basis, the developer team’s view is that the campaign was meant to disrupt participation in the vote.
That is a reasoned suspicion based on context and timing — not a proven forensic conclusion. The technical evidence shows what was done and where it came from, not who ordered or paid for it. The attack ran on commodity, rentable infrastructure — ordinary commercial hosting plus large pools of home and mobile internet connections — using off-the-shelf attack tools. We saw no sign of custom or state-grade capability. That points to a broadly available, for-hire capability, which describes the instrument but not the customer. We also saw almost no Tor use and no evidence in the available data that the bots solved or bypassed Cloudflare’s human-verification challenges.
One concrete link is worth noting, with a caveat about how far it reaches. In two of this campaign’s seven waves — the May 15 wave and the eight-day May 18–26 wave — some of the same high-volume attack machines also appear in earlier attacks on the Belarusian outlet pozirk.online; the other five waves show little or no such overlap. So the link is real and measured, but it is specific to those two waves, not a sign that the whole campaign shared infrastructure. And even where it holds, shared infrastructure can also mean the same rented attack service was hired by different customers, so we treat it as a supporting indicator, not proof of a single operator.
Public attribution context. Public reporting and statements by election organizers support a stronger attribution assessment than the network telemetry alone can provide. Pavel Liber, responsible for the technical side of the voting platform, publicly stated that a dedicated team of specialists “hired by the regime” was working to disrupt the election, while RFE/RL reported that organizers suspected state involvement in the DDoS attacks. Belarusian independent media also placed the cyberattacks in a broader campaign of pressure by Lukashenko’s government, including the KGB’s designation of candidate lists as “extremist formations,” searches of candidates’ relatives, information attacks, and attempts to intimidate voters. On that basis, and given the target, timing, and surrounding repression, we assess that the campaign was very likely connected to Belarusian state structures acting on behalf of Lukashenko’s government, while noting that the technical evidence in this report by itself identifies the attack infrastructure and tooling, not the individual operator or contracting chain.
What other organisations can learn
The single most important reason this platform stayed usable is that it was already behind a DDoS protection service before the attack began. The clearest lesson is to put protection in place ahead of time, not during a crisis — onboarding mid-attack is far harder.
A few practical takeaways for organisations that could face something similar:
- Apply for free protection early. Much of this kind of defence is available at no cost to qualifying nonprofits and media through programmes such as Cloudflare’s Project Galileo. Apply before an incident, not during one.
- Basic DDoS protection is genuinely effective. Even the free tier blocked the some portion of this attack. It is the highest-value first step. The defensive outcome also depended on active incident response, not only on Cloudflare being present in front of the site. Operators had to monitor the campaign continuously and adjust controls as the attack shifted, including turning country-level blocks and stricter rate limits on and off to balance mitigation against collateral damage to legitimate users.
- Your own server is still the weak point. The shield protects the edge, but the waves that hurt most were the ones that reached the back end. Make sure the server can shed load gracefully — through rate limits (capping how many requests a single source can make), caching (serving saved copies so requests don’t all hit the server), and a stale-page fallback (showing the last good version of a page when the server is struggling).
- Tighten visitor checks during an attack. Lightweight automated checks let real users through while filtering out bots. For a site under sustained attack, an interactive check — the kind that asks a person to confirm they’re human — can stop automated traffic that slips past the basic filters.
- Watch the first wave. Defences are often least tuned at the very start of an attack, which is exactly what happened here. Have an emergency contact and a response plan ready so you can tighten rules fast.
- Expect break-in probing alongside the flood. Floods often come with scanning for weak spots. Keep configuration files, passwords, and admin pages locked down and off the public internet.
The encouraging takeaway: a well-prepared, well-shielded platform — even a small nonprofit one — can absorb a multi-billion-request attack and keep an election running.
- Scope: This report analyses a single domain —
nbgov.organd its service subdomains (e.g.votingapi.nbgov.org,idapi.nbgov.org) — using only the Cloudflare data available to ThreatLab for that domain. The 2026 Coordination Council election infrastructure was broader than this one domain, and other domains and services were attacked during the same period; those attacks, any traffic carried by other providers or CDNs, and any activity outside the windows below are out of scope and are not represented in any figure in this report. Every number here describes this domain’s Cloudflare traffic only. - Target:
nbgov.organd its service subdomains — primarilyvotingapi.nbgov.organdidapi.nbgov.org. nbgov.org served as the informational and identity/access infrastructure for the Belarusian Coordination Council election — not the ballot system itself. According to the platform’s technical lead (Pavel Liber), nbgov.org was an informational resource; the actual ballot casting and tallying ran on a separate, third-party verifiable-voting platform (Vocdoni), consistent with that platform’s published architecture (Vocdoni operated the voting layer; the identity/access layer sat in front of it). Despite thevotingapisubdomain name, the endpoints attacked here (votingapi,/polls/,idapi) are nbgov.org’s app-facing voting and identity access services, not the system of record where votes were cast or counted. - Window analysed: May 12, 18:00 → May 26, 12:15 Minsk time (GMT+3; May 12, 15:00 → May 26, 09:15 UTC). Export filenames are in UTC; all timestamps in this report are Minsk time unless labelled otherwise.
- Number of waves: 7 distinct attack waves over 14 days, ranging from a 15-minute burst to a continuous 8-day flood.
- Total volume: ~3.4 billion requests across the monitored period, attack-dominated — in the major waves, legitimate baseline traffic ran 4–5 orders of magnitude below the flood; even the smallest wave was several hundred-fold above baseline (measured pre-attack baseline ≈ 250–1,050 requests per 15 minutes; see Timeline). Headline per-wave totals therefore represent attack traffic over a negligible legitimate baseline, not attack-only captures. This figure is the volume observed in the Cloudflare exports available to ThreatLab for nbgov.org’s service subdomains and the windows described here; it is not a total for all providers, infrastructure, or election-related attack traffic, and should not be read as one. For scale, the election organisers (Vocdoni/Society22) publicly reported the broader platform facing roughly 24 billion requests and ~68 TB of attack traffic across the whole election period (Vocdoni).
- Highest-intensity wave: 634 million requests across the May 15 export window (15:30–20:00 UTC), the active flood running ~4h15m to ~22:45 Minsk, peaking at ~161,000 req/s (
votingapi). Largest by total volume and longest: 2.67 billion requests over ~8.2 days on May 18–26 (idapi). - Peak rate: ~161,000 requests/second (15-minute-average basis), May 15.
- Defence: Cloudflare. Custom WAF rules, managed WAF rules, the L7 DDoS engine, and rate-limiting rules were all observed firing in the data. Cloudflare plan tier was “Business”.
- Data sources: Cloudflare GraphQL Analytics exports — request timeseries (1h / 15m), top-N dimension breakdowns,
securitySource-stratified request samples, per-IP request samples for the dominant ASNs, and ipinfo.io per-IP enrichment — plus one Cloudflare dashboard screenshot (May 17). The exports are unfiltered host traffic (no attack-URL filter), so they contain whatever legitimate voting traffic was present; this report attributes volume to “attack” only for cohorts the data identifies as blocked, malformed, rate-limited, or synthetic, and states the legitimate baseline explicitly.
For technical readers
The technical sections below restate and substantiate every claim made in the Summary; some overlap with Part 1 is intentional, so a technical reader can trace each plain-language statement to specific observations.
Timeline
Seven waves over fourteen days. The first six are short, sharp floods against the May 12–17 voting activity; the seventh is a continuous eight-day flood that switched targets to the identity service. Campaign shape (request volume, log scale, Minsk time):
| Wave | Active span (Minsk) | (UTC) | Duration | Target host | Total reqs (attack-dominated) | Window unique IPs | Peak per-IP rate | Edge signature |
|---|---|---|---|---|---|---|---|---|
| 1 | May 12, 18:00–18:45 | 15:00–15:45 | ~45 min | votingapi /polls/ | 43.7 M | 22,274 | ~1.8 req/s | 400 77%, 502 11% |
| 2 | May 15, 18:30–22:45 | 15:30–19:45 | ~4h15m | votingapi | 634.0 M | 413,514 | ~0.4–5.3 req/s | 403 81%, 429 9%, 521 4% |
| 3 | May 16, 10:00–10:30 | 07:00–07:30 | ~30 min | votingapi + idapi | 34.9 M (in span) | 67,802 | ~1.4 req/s | 403 98% |
| 4 | May 16, 18:00–18:15 | 15:00–15:15 | ~15 min | votingapi | 12.5 M | 13,761 | ~1.5 req/s | 403 88% |
| 5 | May 16, 21:15–21:45 | 18:15–18:45 | ~15–30 min | mixed | 0.75 M (in span) | 1,855 | ~0.7 req/s | 403 45%, 429 41% |
| 6 | May 17, 10:35–11:12 | 07:35–08:12 | ~40 min | votingapi | 16.6 M | 14,291 | ~1.9 req/s | 403 89% |
| 7 | May 18, 07:00 → May 26, 12:15 | 05-18 04:00 → 05-26 09:15 | ~8.2 days | idapi | 2,666.7 M | 50,322 | ~110 req/s (grind) | 403 86%, 200 14% |
Onset/decline precision. Waves 1–6 are bounded by 15-minute timeseries; the 1-minute series had aged out of Cloudflare’s retention, so sub-15-minute edges are interpolated. A separately-provided Cloudflare dashboard screenshot for May 17 (1-minute resolution; not part of the export archive) shows wave 6’s clean cliff at ~11:12 Minsk and is the basis for that wave’s narrower span — on the 15-minute export alone, wave 6 is bounded only as roughly 10:30–11:15 Minsk. Several export brackets are wider than the attacks they contain: wave 3’s bracket runs four hours but the flood is a single 30-minute spike (07:00–07:30 UTC, then baseline); wave 5 is one ~15-minute spike with minor echoes. The “Total reqs (in span)” figures exclude the baseline-only remainder of those brackets — for wave 3 that means 34.9 M during the active 30-minute spike, within a 38.8 M four-hour export bracket (the difference is baseline and minor later blips). Wave 3’s bracket also mixes targets: of the 38.8 M bracket total, ~27.9 M hit votingapi (/polls/ and random cache-buster paths) and ~10.9 M hit idapi — it is not a single-host event, and the host split is over the full bracket rather than the 30-minute spike alone.
IP-pool dynamics. Wave 2 rotated a very large residential pool — 4,464 active IPs in the opening 15 minutes, rising to ~66,000 mid-attack, 413,514 distinct across the window. Wave 7 is the opposite: it opened with a 3.7 M-request spike at 07:00 Minsk on May 18, a brief lull, then high-IP bursts through ~11:00 Minsk (10,000–12,000 IPs/hour), after which it settled into the multi-day sustained phase running on only ~20–40 distinct IPs per hour at ~110 requests/second each. The sustained phase was a small fixed hosting fleet rather than a botnet; the opening bursts, by contrast, drew on a much broader IP pool. The per-IP rates are computed as requests ÷ unique IPs ÷ 900 per 15-minute bucket and vary across each wave’s phases; the ranges above bracket plateau vs. peak.
Recon during the window. Waves 1–6 carried only trace reconnaissance (occasional /.git/config, /audit/*, /privacy.html, /verification/* probes in the samples), at background levels — the floods were not used as cover for probing. Wave 7 is the exception and is documented in the Mitigation Pipeline below. This report covers only the attack windows; it makes no claim about reconnaissance before the exported periods, which would require wider-range data.
Mitigation pipeline
Cloudflare classifies each request by securitySource (which engine acted) and records both the edge status returned to the client and the origin status (with 0 meaning origin was never contacted). The export normalises Cloudflare’s field values to lowercase/snake_case — e.g. the export’s managed_challenge, ratelimit and managed_challenge_bypassed correspond to Cloudflare’s documented managedChallenge, rateLimit and managedChallengeBypassed; field names below follow the export. In the securitySource-stratified samples, l7ddos and firewallManaged consistently map to 403 (blocked) and ratelimit maps to edge 429; firewallCustom mostly blocks with 403 but also appears in skip and origin-touching paths in several waves (400/502 with securityAction: skip in wave 1; a 403/429 mix in wave 5; some 200/502 in waves 6–7). Because the samples are stratified by securitySource (equal records per engine, not proportional to volume), and no securitySource×status timeseries was provided, the combined 403 block share is firm but the split between the blocking engines cannot be recovered from this export.
| Wave | Blocked at edge (403) | Edge 429 | Origin not contacted | Origin-touching | Origin outcome |
|---|---|---|---|---|---|
| 1 | 4.2% | — | 11.7% | 88.3% | origin reached; returned 400 to 77%, 502 to 11% |
| 2 | 81.2% | 9.4% | 86.9% | 13.1% (83.2 M) | origin-status 429 to 58.9 M (origin load-shedding), 502 7.1 M, 503 4.0 M, 200 9.4 M; plus edge 521 for 26.1 M (origin unreachable) |
| 7 | 85.8% | 0.3% | 99.89% | 0.11% (2.9 M) | origin essentially untouched |
Wave 7 — edge held almost completely. Across 2.67 billion requests, origin was contacted ~2.9 million times in eight days (~4.1 req/s average over the window; 0.11% of all requests). The 13.9% that returned edge-200 are not application successes: ~92% of them are requests to /cdn-cgi/trace, Cloudflare’s own edge diagnostic endpoint, served at the edge (cacheStatus: none, origin not contacted). The “site survived because Cloudflare absorbed it at the edge” framing is correct here — the antithesis of an origin-overload outcome.
Wave 7 — flood plus scanner. Wave 7’s volume was spread near-equally across a fixed list of paths rather than concentrated on one endpoint: in the aggregate URL breakdown, /, /cdn-cgi/trace, /wp-login.php, /search, /api/v1/, /index.php and /admin each received roughly 369 M requests — a tool cycling a path list. Several of those (/wp-login.php, /index.php, /admin) are admin/break-in targets, and the stratified samples additionally show lower-volume probes for /.env and ~20 .env.* variants, /.git/config, /.git/HEAD, /.aws/credentials, /firebase-service-account.json, /serviceAccountKey.json, /secrets.json and .php web-shells. These scanner-style paths appear across multiple mitigation cohorts in the samples (l7ddos, firewallCustom and firewallManaged), so the data supports the scanner finding but does not let us attribute all of it to one specific engine. The net characterisation holds: wave 7 combined a volumetric flood with concurrent credential/admin-path scanning — a qualitatively different operation from the pure floods of waves 1–6.
Wave 2 — origin took real pressure. Edge blocked 81%, but origin distress is unambiguous. Cloudflare returned edge 521 for ~26 M requests; Cloudflare defines 521 as the origin refusing connections from Cloudflare, with documented common causes being an offline origin web server application and blocked or rate-limited Cloudflare requests (Cloudflare 521 docs). Origin overload or connection exhaustion is plausible here given the simultaneous 502/503 and origin-side 429 pattern, but that is our inference, not a Cloudflare-documented cause, and origin-side logs would be needed to confirm the mechanism. Alongside the 521s, origin returned 7.1 M 502 and 4.0 M 503 errors. Separately, the largest origin-touching cohort is ~58.9 M requests that origin itself answered with 429 — the application (or its own rate limiter) shedding load under pressure, not a Cloudflare edge block. (Edge 429s total 59.8 M; the aggregate origin-status export shows ~58.9 M of those carrying origin-status 429, so only a small remainder is true Cloudflare edge rate-limiting with origin not contacted.) Finally, ~9.4 M requests reached the voting endpoint and returned 200; that 9.4 M is a mix of genuine voting activity and unblocked attack traffic the data cannot cleanly separate, bounded well below by the site’s normal traffic level (~4,000 req/hour pre-attack, so on the order of low tens of thousands across the window) — meaning it is overwhelmingly unblocked attack traffic reaching origin, not a measure of voters served.
Wave 1 — the near-miss. Only 4.2% was edge-blocked. 77% reached origin as malformed requests (securitySource: unknown) and origin returned 400 — the web server stayed up and fast-rejected them cheaply — but 11% still drove origin to 502. This is the least-mitigated wave: malformed traffic that edge filtering did not classify, reaching origin directly. As wave 1 it predates the tighter 403-blocking visible in every later wave; whether the defences were subsequently tuned is an observation we cannot confirm from this data.
Origin failure mode (waves 1–2). Wave 2’s origin-touching traffic splits into load-shedding (origin-status 429, ~58.9 M — origin reachable but actively refusing) and outright failure (edge 521 ~26 M, plus 502/503 ~11 M). The failure subset is dominated by 521/502 (connection refused or broken) with 504 timeouts essentially absent — a pattern consistent with the origin infrastructure’s front edge being saturated or connection-capped rather than the application timing out slowly, though the export alone cannot confirm the mechanism. If that reading holds, the operations remedy points at origin connection/concurrency limits and the rate-limiter threshold rather than application-layer latency. Wave 1 differs: there the origin answered 77% with 400 (fast malformed-request rejection) and failed with 502 on ~11%.
Collateral / real-reader impact. No cache-aware non-attack-URL export was provided, and HTML page-caching on an API host is not expected, so this report does not assert a “voters served vs. failed” split. The firm handle on legitimate volume is the pre-attack baseline (~250–1,050 req/15min depending on wave). Given origin returned 521/502/503 during the wave-2 peak, the genuine voting experience was very likely degraded during that window; the data does not support quantifying it further.
This outcome should not be read as Cloudflare’s default posture automatically absorbing the campaign without operator intervention. After the first wave, the defenders actively tuned the protection stack during the incident — including temporary country-level blocks for high-volume source geographies such as India and Brazil, and tighter rate-limiting / WAF rules — and these manual changes were an important part of why later waves were blocked or handled at the edge.
Coordination evidence
Per-IP samples for the dominant ASNs split the campaign into two internally-coherent toolchains on behavioural axes the aggregates hide:
| Residential cluster (waves 1, 2, 6) | Hosting cluster (wave 7) | |
|---|---|---|
| HTTP protocol | HTTP/2 (100%) | HTTP/1.1 (100%) |
| User-agents per IP | 1–3 (UA assigned per-IP, stable) | ~97–104 (per-request UA rotation inside each bot) |
| Cross-ASN UA-family similarity | JS distance 0.05–0.20 | JS distance 0.005 (near-identical across 8 hosters) |
| Source type | residential / mobile ISPs | bulk commercial hosting |
Wave 7 is a textbook “one tool, many infrastructures”: eight unrelated providers/networks (Hetzner, DigitalOcean, AWS, Contabo, NIXVAL, ICT Bulut, Vodafone NL, EXEA — predominantly bulk hosting, plus Vodafone Libertel which is an ISP) show an almost identical user-agent-family distribution (Jensen-Shannon distance 0.005), with every IP cycling ~100 user-agents per ~200 sampled requests — a per-request randomiser. The residential cluster is also internally consistent (a single tool) but a different one: HTTP/2 rather than HTTP/1.1, and each IP holding to one or two user-agents rather than rotating per request. All three independent axes — protocol, per-IP rotation, and source type — agree on the two-tool split, which is why this report treats the early waves and wave 7 as separate operations. Per-IP coordination evidence was computed for waves 1, 2 and 6 (residential) and wave 7 (hosting); per-IP samples also exist for waves 4 and 5 but were not run through the cross-ASN computation, and wave 3 has no per-IP samples. Waves 3–5 match the early-phase aggregate pattern (HTTP/2, residential/mobile sources, voting-API target) and are grouped with the early toolchain on that basis, at lower confidence than the sampled waves.
Source attribution
Tor is negligible in every wave (0.0–0.3% of requests). This is not a Tor-routed campaign — a notable contrast with other politically-motivated attacks on Belarusian publishers. ipinfo flags some Tor IPs per-IP (e.g. 1,033 in wave 7, including 185.220.101.0/24 / AS60729 Foundation for Applied Privacy), but request-weighted they are a rounding error.
The per-IP vs. per-request contrast is the central source finding for wave 7. ipinfo, which counts each IP once, classifies wave 7 as 83.3% ISP / residential and only 8.4% hosting by IP, with residential telcos (Reliance Jio, Türk Telekom, Bharti Airtel, PLDT, Uzbektelekom) at the top. Cloudflare’s request-weighted view is the opposite: the volume is hosting-dominated — Hetzner 20.9%, DigitalOcean 12.7%, Contabo 9.2%, AWS 8.0%. The discrepancy is the finding: the brief opening spikes pulled in tens of thousands of residential IPs (inflating the per-IP count), while the eight-day grind that produced almost all the volume ran on a handful of hosting IPs firing tens of millions of requests each. A hosting IP that sent 30 million requests counts the same in ipinfo as a residential IP that sent ten. Wave 7’s top routes also include 154.30.104.0/21 (AS46261 QuickPacket, a known bulk hoster) and Hetzner’s Helsinki capacity (Finland is 19.9% of requests).
Waves 1–2 were genuinely residential/mobile by both measures. ipinfo classifies wave 1 as 90.5% ISP and wave 2 as 91.0% ISP, with large mobile (35,852 IPs in wave 2) and VPN (21,030) flags; top sources are national telcos across India, Brazil, Türkiye, Bangladesh, Pakistan and Saudi Arabia. Wave 2’s 413,514 distinct IPs are a real, large residential/mobile pool — a botnet or residential-proxy network — distributed across Brazil (9.7%), India (6.5%) and Türkiye (5.1%) with no single dominant source (top ASN Türk Telekom at 2.7%). Some commercial hosting/VPN appears in the request-weighted tail (e.g. WorkTitans B.V., Google Cloud ~1%). (The ipinfo enrichment covers 400,000 IPs against Cloudflare’s 413,514 distinct addresses, so the per-IP percentages are over a ~97% sample of the pool, not the full set.)
Cross-campaign IP overlap (pozirk). A separate ThreatLab tool compared this campaign’s per-IP request counts against the source-IP sets of two earlier attacks on pozirk.online — the pozirk May 9–10, 2026 and pozirk May 17–18, 2026 incidents — using exact-IP matching filtered to addresses with more than 100 requests on both sides (which excludes incidental and legitimate overlap), reported request-weighted. The nbgov-side totals in that tool match this report’s exports exactly; the pozirk-side IP sets are prior ThreatLab data and were not re-derived here. Overlap is concentrated in two waves:
| nbgov wave | pozirk attack | shared IPs (>100 req both) | share of nbgov wave | share of pozirk attack |
|---|---|---|---|---|
| Wave 2 (May 15) | pozirk May 9–10 | 3,840 | 26.3% | 54.0% |
| Wave 2 (May 15) | pozirk May 17–18 | 2,347 | 18.2% | 36.7% |
| Wave 7 (May 18–26) | pozirk May 17–18 | 1,662 | 1.0% | 89.3% |
| Wave 7 (May 18–26) | pozirk May 9–10 | 1,186 | 0.1% | 13.6% |
| Waves 1, 3, 4, 5, 6 | either | ≤423 | ≤1.5% | ≤0.5% |
Two patterns: wave 2 ↔ pozirk May 9–10 is a strong two-sided match (a quarter of the nbgov wave and over half of the pozirk attack run on shared high-activity IPs), while wave 7 ↔ pozirk May 17–18 is a one-sided containment — a sliver of the much larger nbgov wave, but nearly all of the pozirk attack’s volume. At the /24-prefix level the wave-7 containment is higher still: 98.6% of the pozirk May 17–18 attack’s prefix-level request volume came from /24s also used against nbgov. The remaining five waves show only weak or incidental exact-IP overlap.
Two caveats on interpretation. First, the request-weighted shares are carried by high-volume hosting-type addresses — individual IPs that sustained millions of requests in each campaign (examples in the shared set include ranges such as 141.98.169, 5.180.30, 45.139.77, 92.63.226 and 147.45.x) — consistent with the hosting dominance of wave 7’s request volume. Second, the /24s most shared by IP count are Tor exit ranges (185.220.101.0/24, 23.129.64.0/24, 192.42.116.0/24); these are a fixed public exit set that any Tor-using attack will share, so they are weak as a linkage signal and do not drive the request-weighted shares above (Tor is request-negligible in nbgov). The overlap is therefore best read as reuse of the same rentable high-volume infrastructure across both campaigns; whether the same operator or the same rented service, the per-IP data alone does not distinguish (see Attribution).
Notable source ASNs observed in this campaign: AS24940 Hetzner, AS51167 Contabo, AS14061 DigitalOcean, AS14618 Amazon, AS47952 ICT Bulut (TR hosting), AS13287 NIXVAL / FALBOX S.L. (ES hosting — the same NIXVAL named above), AS60713 EXEA (PL hosting), AS33915 Vodafone Libertel (NL ISP), AS209847 WorkTitans B.V. (NL hosting/VPN); and on the residential side AS45899 VNPT, AS7552 Viettel, AS8151 UNINET (MX), AS17639 Converge ICT (PH), AS9299 PLDT (PH). The bulk-hoster AS46261 QuickPacket and the AS60729 Tor exit route also appear.
Bot fingerprint
Synthetic user-agent construction is visible in every wave. Wave 1’s aggregate UA list spreads near-evenly across consecutive Chrome versions — Windows Chrome 142, 143, 144, 145 and 146 each at roughly 1.9–2.2 M requests, with a tail of Firefox 135/136 and older Chrome builds. These are real, if by now historical, versions; the tell is not that any are fake but that a near-uniform distribution across a run of consecutive versions is implausible for a real auto-updating user population (which clusters on the current one or two stables) and is best treated as a generator artifact. Wave 7’s UA list is Mac/iOS Safari strings appearing in paired-duplicate volumes (e.g. two entries at ~71.7 M, four at ~35.9 M), the signature of a fixed UA list iterated by a randomiser. Protocol stack is uniform within each cluster: HTTP/2 + TLS 1.3 + GET for waves 1–6, HTTP/1.1 + TLS 1.3 + GET for wave 7. Query-string use varied by wave rather than being absent: the voting-service floods carried pagination-style strings (?page=0&size=20&strategy=newbelarus — 43.7 M in wave 1, ~330 M across variants in wave 2), while wave 7 appended large numbers of random ?q=<8-char> cache-buster strings (tens of millions each). One tool artifact is worth noting: ~266 M of wave 2’s requests carried the pagination query with doubly HTML-escaped ampersands (&amp;), alongside ~64 M with the correct & form — a templating quirk that is itself a fingerprint.
No observed challenge-solving. The sampled securityAction values are block, managed_challenge, skip and unknown (ratelimit appears as a securitySource, not a securityAction). No solved or bypassed managed-challenge action appears anywhere in the sampled data — neither Cloudflare’s managedChallengeBypassed nor the interactive/non-interactive solved action families (the export carries no such values at all). Within this sample, where Cloudflare issued a managed challenge, no cohort is recorded passing it. The safe statement is therefore that there is no evidence of challenge-solving in the sampled data; a categorical claim would also require challenge-solve-rate analytics and cf_clearance reuse checks across the full logs, which were not part of this export. (JA3/TLS fingerprinting is not exposed at this Cloudflare tier and was not used.)
Technical interpretation
What it was. A two-week, seven-wave Layer-7 HTTP-flood campaign against a Belarusian democratic-movement election platform, escalating from short bursts to a 634 M peak over a ~4h15m active flood and a 2.67 B eight-day grind, aimed at the voting and identity services. It was delivered by at least two distinct commodity toolchains (Coordination Evidence): a residential/mobile, HTTP/2, per-IP-stable-UA tool for the early waves (per-IP-confirmed for waves 1, 2 and 6; waves 3–5 grouped by their matching aggregate pattern), and a hosting-based, HTTP/1.1, per-request-UA-rotating tool for wave 7, the latter bundling a concurrent credential/web-shell scan (Mitigation Pipeline).
What it wasn’t. Not adaptive (no TLS variation, no path adaptation to defences, no challenge-solving observed — Bot Fingerprint); not Tor-anonymised (Source Attribution); not a stealthy intrusion. No bespoke or state-grade tooling was observed — the infrastructure is broadly-rentable commercial hosting and consumer/residential IP space running off-the-shelf tools. This characterises the toolchain, not the actor: it does not identify who ordered or rented it.
Defence outcome. Cloudflare’s edge blocked or handled most of the campaign’s volume — overwhelmingly so after the first wave. Wave 7’s origin was essentially untouched (99.89% never contacted; the residual edge-200s are /cdn-cgi/trace, not application traffic). Wave 2’s origin took the heaviest absolute distress (~26 M edge-521, plus ~11 M 502/503, and ~58.9 M origin-returned 429 load-shedding — the latter origin-side, not Cloudflare edge rate-limiting), and a bounded mix of attack traffic and genuine voting reached the endpoint. Wave 1 is the exception: malformed traffic bypassed edge classification and reached origin, which mostly fast-rejected it (400) but failed (502) on ~11%. The managed-WAF rules visible in the data — consistent with Business-level protections — flagged wave 7’s scanner paths; the bulk of the May 15 429 load-shedding was origin-side rather than Cloudflare edge rate-limiting.
Per-source asymmetry (defender-side). Edge treatment was not uniform across sources: in waves 1–2, hosting/VPN ranges (M247, CHINANET, MAXKO) were edge-blocked at ~100%, while residential-mobile ranges reached origin (as 400 in wave 1, as 200/429 in wave 2). Following the methodology’s interpretive principle, this is best read as Cloudflare’s reputation model treating low-trust hosting ranges more harshly than residential IPs — a defender-side effect — rather than the attacker deliberately behaving differently by source.
Quick reference
| Metric | Value |
|---|---|
| Target | nbgov.org — votingapi (waves 1–6), idapi (wave 7) |
| Campaign window | May 12, 18:00 → May 26, 12:15 Minsk (GMT+3) |
| Waves | 7 (45 min to 8.2 days) |
| Total volume | ~3.4 B requests, attack-dominated |
| Highest-intensity wave | 634 M / ~4h15m active, ~161k req/s peak (May 15, votingapi) |
| Largest by volume & longest | 2.67 B / ~8.2 days (May 18–26, idapi) |
| Peak rate | ~161,000 req/s (15-min-avg basis, May 15) |
| Sustained per-IP rate (wave 7 grind) | ~110 req/s on ~20–40 IPs |
| Largest IP pool | 413,514 distinct IPs (wave 2) |
| Edge block (403) | 81% (wave 2), 86% (wave 7), 4% (wave 1) |
| Origin not contacted | 86.9% (wave 2), 99.89% (wave 7), 11.7% (wave 1) |
| Tor share | 0.0–0.3% (all waves) |
| Challenge-solving | none observed |
| Toolchains | ≥2 (residential HTTP/2; hosting HTTP/1.1 + scanner) |
| Pre-attack baseline (legit) | ~250–1,050 req/15min |
| Cross-campaign overlap | wave 2 ↔ pozirk May 9–10 (26%/54%); wave 7 ↔ pozirk May 17–18 (1%/89%) |
| Defence | Cloudflare (custom WAF + managed WAF + L7 DDoS + rate-limit active); Business plan) |