Prepared by: RESIDENT.NGO ThreatLab
Detection Date: May 9, 2026
Publication Date: June 1, 2026
Classification: Distributed Denial of Service (DDoS) Attack — Layer 7 (HTTP Flood)
Target: pozirk.online (paths “/” and “/ru/”)
Window analysed: May 9 21:35 – May 10 10:30 Minsk time (GMT+3; May 9 18:35 – May 10 07:30 UTC). All timestamps in this report are Minsk time unless labelled otherwise. The attack lasted just over 12 hours
Attack volume (eyeball): 14.38 billion client requests / 31,293 unique IPs
GraphQL total (incl. Cloudflare-internal Early Hints): 15.36 billion
Data sources: Cloudflare GraphQL Analytics exports — 15-minute timeseries (incl. securitySource × edgeResponseStatus), top-N breakdowns (status, URL, ASN, IP, country, UA, datacenter), securitySource-stratified sample (120 time buckets × up to 200 samples per securitySource stratum, ~81k records), per-IP samples across 8 attacker ASNs (8k records), and ipinfo.io classification of all 31,293 unique attacker IPs.
Summary
RESIDENT.NGO analyzed a significant more than 12-hour DDoS attack involving a botnet of approximately 31,000 unique IP addresses targeting Pozirk.
Pozirk is an independent Belarusian news agency in exile that publishes news, analysis, interviews and comments about developments in Belarus in Belarusian, Russian and English. Pozirk.online was launched by journalists who had worked for BelaPAN, Belarus’ oldest independent news agency, and Naviny.by, the country’s first online daily. Journalists and editors were forced to leave the country after the Committee for State Security (KGB) branded BelaPAN an extremist group in November 2021.
A Distributed Denial of Service (DDoS) attack is an attempt to take a website offline by flooding it with so many requests that real visitors cannot get through. The requests come from a large number of computers — sometimes thousands, sometimes tens of thousands — coordinated by a single operator. Each individual request looks roughly like a normal visit; the harm comes from the volume.
Website sits behind Cloudflare, a service that acts as a buffer between a website and the public internet. When an attack hits, Cloudflare’s edge network attempts to absorb the bad traffic before it reaches the actual web server (the “origin server” where the site’s content lives). Whether the site stays online during an attack depends almost entirely on whether Cloudflare’s filters recognise the attack and block it.
What happened
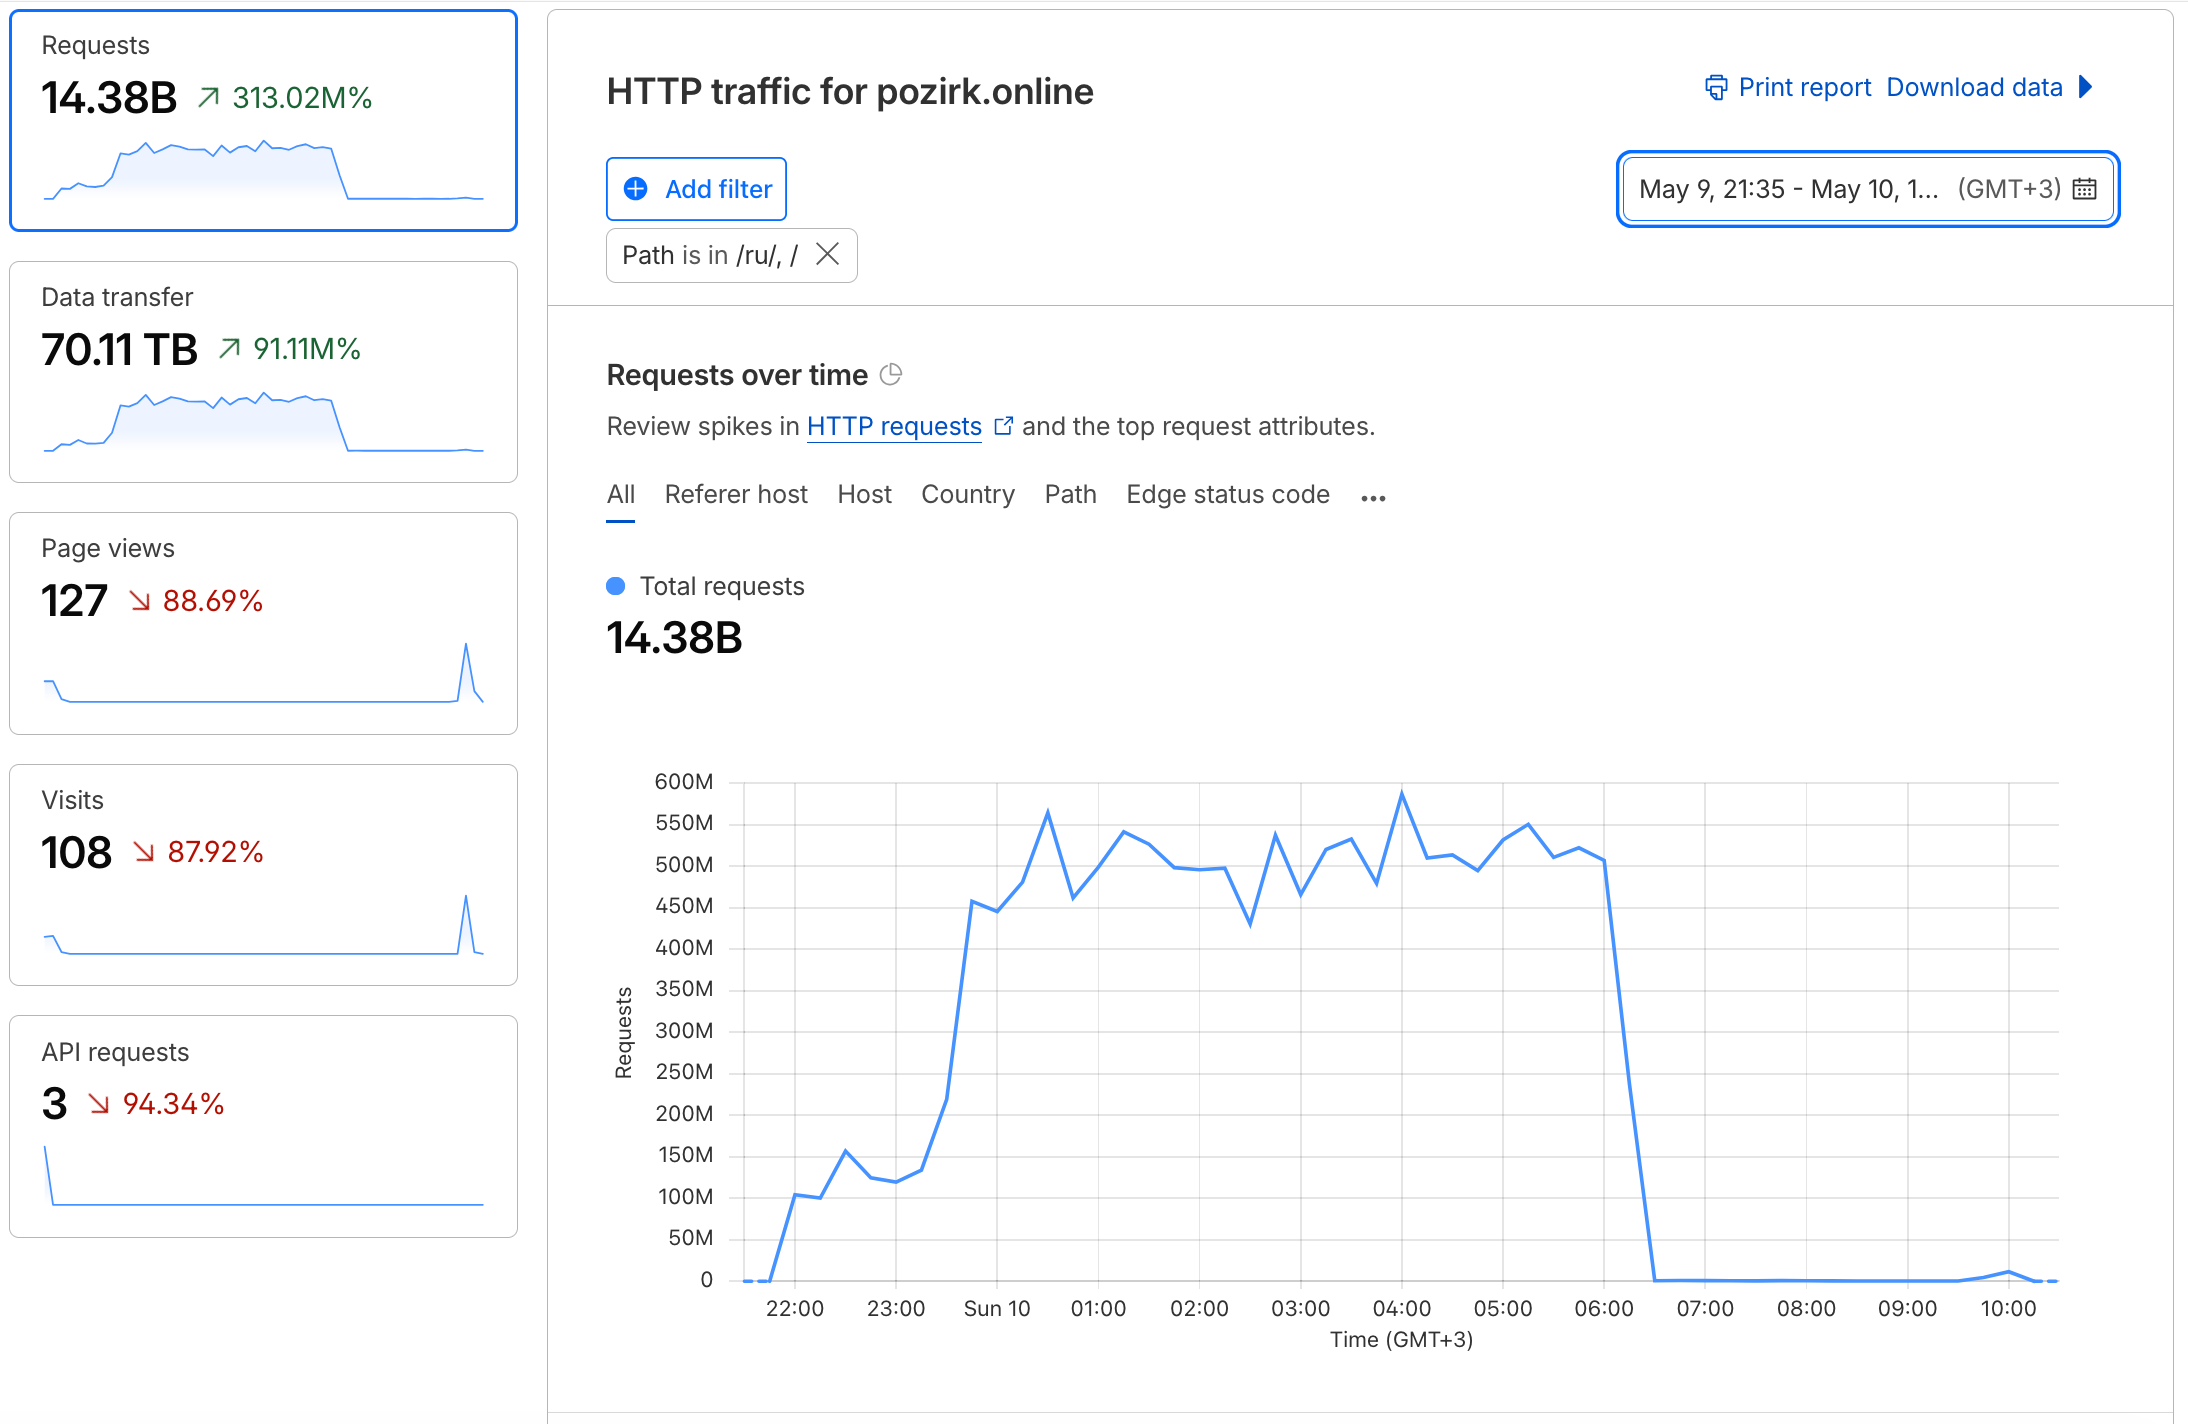
Between 22:00 on May 9 and 10:15 on May 10, pozirk.online was hit with 14.38 billion HTTP requests sent from 31,293 unique IPs across two distinct phases of an attack lasting just over 12 hours. The main flood — averaging ~512,000 requests per second and peaking at 672,000 — ran from 22:00 May 9 to 06:30 May 10, targeting the site’s two main entry points (“/” and “/ru/”). At 06:30 the bulk of the attack dropped sharply, but a smaller solver-only continuation kept hitting the site for another three hours: ~135 concurrent IPs in the “challenge-solver” cohort, pushing ~520 requests per second through to origin via the challenge-bypass path until ~09:30, followed by a brief 15-minute residual at ~10:00. Cloudflare’s L7 DDoS engine blocked 99.43% of the main-flood traffic at the edge with HTTP 403 responses. The remaining ~0.3% was traffic from bots that successfully solved Cloudflare’s automated security challenge — about 41 million requests across the campaign, reaching origin at roughly 1,276 rps during Phase 1 and ~520 rps during Phase 2. That sub-stream was enough to drive origin into total failure. For the entire 12-hour attack window, real readers attempting to load article pages saw almost nothing succeed: among origin-dependent reader-like HTML requests (excluding the much larger volume of WAF-blocked scanner probes), only 57 page loads returned successfully — a ~2.4% success rate, against a healthy baseline, and effectively zero through the core of the outage. Cloudflare’s edge cache was not configured to serve stale HTML when origin failed, so the only HTML responses readers received were either error pages (5xx from origin), Cloudflare challenge pages, or WAF blocks. Static assets like CSS, JS and images continued being served from edge cache, but the HTML article pages they belonged to almost never loaded. Origin began returning successful HTML responses around 10:15 May 10 — roughly 45 minutes after the solver continuation ended and ~15 minutes after a brief residual spike at 09:45–10:00 finished. The relatively quick recovery (once the attack genuinely stopped) is consistent with the failure being caused by ongoing attack pressure rather than by lingering damage to the server itself.
Key findings
The attack was about 50× larger by request count than the May 17–18, 2026 attack on pozirk.online that this ThreatLab team also analysed. The May 17–18 incident delivered ~290 million requests; this May 9–10 incident delivered ~14.4 billion across a 12-hour campaign. (Despite analysis order, May 9–10 is the chronologically earlier event of the two.) The Phase 1 sustained rate (~512k req/s) and peak (~672k req/s) are large enough to qualify as a major commercial-tier flood. Cloudflare’s adaptive L7 DDoS rule absorbed the overwhelming bulk of it at the edge, but the small fraction that bypassed (see next finding) was enough to take the origin server down for the duration of the campaign.
The attacker infrastructure looks dramatically different from the May 17–18, 2026 attack on the same site. The later May 17–18 incident leaned heavily on Tor exit nodes (~40% of traffic) plus a single dominant US bulk hoster (QuickPacket, ~33%). This May 9–10 incident shows the opposite footprint: no single network accounts for more than 3.1% of traffic, the top 10 networks together cover only 23%, and Tor is reduced to a 2% sliver. The traffic is broadly distributed across roughly 4,300 networks, dominated by commercial hosting providers worldwide — DigitalOcean, AEZA, Contabo, Google Cloud, Oracle, Cloudflare (AS13335), netcup, OVH, HOSTKEY, Hetzner, Akamai, Scaleway, Alibaba, Tencent, plus a long tail of smaller Russian and European hosting providers.
The attacker’s bots can solve Cloudflare’s automated security challenges, and that capability is what made the attack effective. Approximately 41 million eyeball requests (0.286% of the total) passed Cloudflare’s managed JavaScript challenge — confirming that the bot software executes the challenge code automatically and presents itself to Cloudflare as a legitimate browser. The data shows these clients passed Cloudflare’s managed challenge; it does not identify the specific solver implementation. The challenge issued was a JavaScript challenge (the auto-solvable type, as opposed to an interactive challenge requiring a human to click or solve a visual task); JS challenges are within reach of commodity headless-browser automation, which is consistent with what we observe here. Once past the challenge, these requests were forwarded to pozirk’s origin server. The volume — roughly 1,276 rps during Phase 1’s 8.5h plateau and ~520 rps during Phase 2’s 3h solver-only continuation — was sufficient to overwhelm the origin throughout, which responded with HTTP 502 to virtually all of it. The upstream weak point was the challenge configuration: the bots passed an auto-solvable JavaScript challenge, so the verification step did not filter them. A stricter configuration — an interactive challenge (e.g. Cloudflare Turnstile in a mode that requires interaction), per-IP rate-limiting on the bypass path, or tighter origin protection — would plausibly have reduced the origin-reaching cohort. The data cannot prove any specific challenge type would have stopped all of it (Turnstile and managed challenges are themselves adaptive and can run non-interactively). The point stands directionally: origin overload was the downstream symptom, and the auto-solvable challenge passing this bot class was the upstream cause — a defender-configuration matter, not a verdict on the publisher’s origin capacity.
The attack ran in two phases, the second of which kept origin down using just the challenge-solver cohort. Phase 1 (22:00 May 9 – 06:30 May 10) was the main flood: ~2,500 concurrent IPs delivering ~512k req/s at the edge, with ~1,276 rps of that successfully passing the JavaScript challenge and reaching origin. At 06:30 the bulk of the attack stopped — but the solver-capable sub-fleet continued for another three hours, with ~135 concurrent IPs pushing ~520 rps through the bypass path to origin. Each IP in this Phase 2 sub-fleet hit roughly 7× harder than its Phase 1 counterpart (~3.9 rps vs ~0.5 rps per IP through the solver path). Origin remained incapable of serving HTML successfully throughout both phases, and began recovering ~45 minutes after the solver continuation ended at ~09:30 (with a brief residual spike at 09:45–10:00 delaying full recovery until ~10:15). The Phase 2 sub-fleet — a tiny fraction of the original IP pool — was on its own sufficient to keep origin in 5xx failure; the L7 DDoS-blockable bulk of Phase 1 did not contribute to the operational impact beyond what the solver path already produced. Whether Phase 2 was a deliberate “press it down with the solver tail” strategy or simply what was left after the volumetric infrastructure stopped is not visible in the data.
The attack is one tool deployed across many infrastructures. Per-IP samples from eight different hosting providers — including Russian (AEZA), American (DigitalOcean, Oracle, Google Cloud), German (Contabo, netcup), and Dutch (WorkTitans) hosters — show identical protocol stacks (100% HTTPS, HTTP/2, TLS 1.3) and the same two user-agent templates (Firefox on Android 13, Chrome on Android 10). User-agent versions are randomly cycled across browser versions 109 through 146 inside each request — a typical signature of a UA-randomiser library — and every IP rotates through multiple UAs within minutes. This points to a single bot framework deployed across heterogeneous infrastructure, rather than multiple independent attackers coincidentally striking the same target. (This describes the tooling; it is a fingerprint observation, not proof of a rental relationship or a specific operator.)
The defence was strongly reputation-graded. Inside the small fraction of traffic that did reach Cloudflare’s per-site securitylevel layer (0.30% of the total), the bots’ solver succeeded against the JavaScript challenge 94% of the time — but only specific source networks were ever allowed to reach that layer at all. Cloudflare’s L7 DDoS rule matched traffic from hosting and cloud infrastructure (Tor, Google Cloud, DigitalOcean, AEZA, Contabo, Oracle Cloud, WorkTitans, etc.) before the challenge layer ran, returning 403 directly. The ASNs whose traffic did reach the challenge layer were almost entirely ISP-class (Saudi Telecom, VNPT, Uzbektelekom, Philippine Long Distance, Etihad Etisalat, Telecom Algeria, and similar) — and from those, virtually every challenge was solved by the bots. Same bot software everywhere; what varied was the defender’s per-source reputation classification. The infrastructure that produced the bulk of the attack volume (hosting/cloud) was caught at the upstream layer; the small residential-ISP slice that got past it was the cohort that actually reached origin.
Attribution
The editorial office considers this attack related to the upcoming elections to Belarus’s Coordination
Council — the country’s main democratic opposition body operating in exile. Two facts support that suspicion as context, not as forensic proof.
First, pozirk.online published a series of articles in the days preceding the attack covering the Coordination Council and the candidates’ positions; the attack onset (22:00 on May 9) followed a publication in that series https://pozirk.online/ru/news/186557/ and
https://pozirk.online/ru/news/186524/
Second, a separate DDoS attack against pozirk.online on May 17–18 — also covered in a ThreatLab report https://resident.ngo/lab/writeups/ddos-attack-belarusian-pozirk-online-outlet-may-17-18-2026/ — correlates in timing with election-related coverage. The two incidents are similar in target and timing, but their source-infrastructure footprints differ materially: May 17–18 leaned on Tor (~40%) and a single dominant hoster (QuickPacket, ~33%), while May 9–10 was broadly distributed across commercial hosting with no dominant ASN. We therefore analyse them as possibly related incidents in the same political context; establishing a technical linkage would require a side-by-side comparison of UA dictionaries, referers, ASN/IP overlap, paths, and mitigation behaviour, which we have not yet done.
The editorial office suspects this campaign is sponsored was initiated by an actor connected to the Belarusian state, or to interests aligned with it. We present this as a reasoned suspicion based on context, not as a forensic conclusion: nothing in the Cloudflare data identifies the buyer of the attack.
The technical infrastructure observed here — broadly distributed, identically-fingerprinted bot software running across commercial hosters worldwide, with an HTTP-flood capability around 670k req/s and an automated challenge-solver — is consistent with commercial DDoS-for-hire infrastructure. The Cloudflare data does not identify the buyer, the operator, or a specific seller or rental relationship; “consistent with a paid commercial service” is as far as the evidence reaches.
Cloudflare Galileo Project
During this May 9–10 attack, pozirk.online was on Cloudflare’s free plan. The 99.43% edge-blocking and the volumetric absorption documented above were delivered at no cost, which is itself a striking demonstration of how much DDoS protection Cloudflare’s free tier provides to independent media. Two distinctions matter when discussing what more could have helped. Some defences were simply not configured on this site at attack time regardless of plan — notably HTML cache fallback / stale serving for article pages (Cloudflare’s cache and Cache Rules features are broadly available, including stale-while-revalidate behaviour on Free/Pro/Business; the relevant point here is that pozirk had no HTML cache fallback configured, not that it was plan-locked). Other capabilities are plan-gated or more capable at higher tiers — for example, finer-grained challenge configuration and the more advanced sensitivity and response options around the HTTP DDoS Attack Protection managed ruleset and WAF. (Cloudflare’s WAF custom rules are available on all plans, so we do not claim custom rules were unavailable; what higher tiers add is depth of configuration and certain advanced/account-level features.) We separate these deliberately to avoid overstating what the free plan lacked.
From May 14, 2026, pozirk.online has been enrolled in Cloudflare’s Project Galileo, which provides free higher-tier protection to at-risk public-interest organisations including independent media, investigative journalists, and human-rights groups. Galileo broadens the configuration surface available to defend a publishing site against the class of attack documented here — the challenge-solving bypass cohort that reached origin despite Cloudflare blocking 99.43% of the flood at the edge. Stricter challenge options (such as Cloudflare Turnstile configured to require interaction), tighter rate-limiting, and HTML cache fallback are among the levers that could reduce an origin-reaching solver cohort; the data here does not prove any single one would have stopped all of it, but together they materially raise the cost of this attack pattern. Galileo was not yet in effect for this May 9–10 incident; it has been in effect for the subsequent May 17–18 attack covered separately, and remains in place going forward. We’re grateful to Cloudflare and the Galileo programme for the protection they provide to independent publishers — without it, the cost of defending against attacks of this scale would put meaningful DDoS protection out of reach for many small newsrooms.
What this was, and what it wasn’t
This was a high-volume HTTP GET flood against pozirk.online’s two main entry points, delivered in two phases — a 8.5-hour volumetric flood followed by a 3-hour solver-only continuation — by a globally distributed commercial bot framework with automated challenge-solving capability. It was not a sophisticated breach attempt: no application-layer probing, no protocol variation, no adaptation to defences observed across the 12-hour window. Cloudflare’s edge filtered 99.43% of the main flood, but the small bypass cohort consisting of bots that solved Cloudflare’s JavaScript challenge reached origin at roughly 1,276 requests per second during Phase 1 and ~520 requests per second during Phase 2, and held it in total failure for the duration. HTML cache fallback was not configured for article pages, so when origin failed there was nothing to serve in its place — among origin-dependent reader-like HTML requests, only 57 succeeded across the whole window (effectively zero through the 11.5-hour core of the outage). Static assets continued serving from edge cache, but the HTML pages they belonged to almost never loaded. Zero-success interval ~11h 45m, with HTML page-serving recovering around 10:15 May 10 once the attack genuinely ended.
The remainder of this report documents the technical analysis.
For technical readers
Timeline
The attack started at 21:50 on May 9 with a fast ramp from zero to ~150k req/s within 30 minutes, then a second ramp-up at 23:35 to the sustained Phase 1 plateau of ~580–660k req/s, which held essentially flat for 6.5 hours. At 06:20 on May 10, edge volume dropped sharply (590k → 90k req/s in one 15-minute bucket). At 06:30 the L7 DDoS-handled bulk traffic stopped entirely — but a smaller solver-only continuation (Phase 2) immediately took over, sustaining ~500 rps through Cloudflare’s challenge-bypass path and ~520 rps directly at origin for the next three hours. Phase 2 ended around 09:30; a brief 15-minute residual spike around 09:45–10:00 was mostly absorbed by site-specific custom rules, and the campaign ended cleanly at 10:15.
21:35 |                                                             | (baseline)
21:50 | ###                                                         | 40k rps
22:05 | ############                                                | 139k
22:20 | ##############                                              | 166k
22:35 | ##############                                              | 162k
22:50 | #############                                               | 154k
23:05 | ############                                                | 145k
23:20 | ###############                                             | 174k
23:35 | #################################                           | 378k  ← second ramp
23:50 | #################################################           | 550k
00:05 | #################################################           | 555k
00:20 | #####################################################       | 604k
00:35 | ######################################################      | 606k
00:50 | ###################################################         | 575k
01:05 | ####################################################        | 590k
01:20 | #########################################################   | 650k
01:35 | #######################################################     | 620k
01:50 | ###################################################         | 579k
02:05 | ###################################################         | 581k
02:20 | ##################################################          | 565k
02:35 | ################################################            | 540k
02:50 | #######################################################     | 622k
03:05 | ###################################################         | 572k
03:20 | ########################################################    | 630k
03:35 | ######################################################      | 606k
03:50 | ######################################################      | 613k
04:05 | ##########################################################  | 659k
04:20 | ######################################################      | 607k
04:35 | ###################################################         | 580k
04:50 | #####################################################       | 594k
05:05 | ############################################################| 672k  ← peak
05:20 | #######################################################     | 617k
05:35 | #####################################################       | 602k
05:50 | #####################################################       | 604k
06:05 | #####################################################       | 594k
06:20 | ########                                                    | 90k  ← Phase 1 cliff
06:35 |                                                             | 0.7k ← Phase 2 begins (solver-only)
… ~500 rps sustained solver-only attack through 09:30
09:50 | #                                                           | 11.8k ← brief Phase 3 spike
10:05 |                                                             | 7.3k
10:20 | | end| Phase | Window | Duration | Edge req/s | Origin-reaching rps (HTML) | Mean active IPs | Per-IP bypass-path rate |
|---|---|---|---|---|---|---|
| Pre-attack | before 21:50 May 9 | — | <1 | 0 | <100 | — |
| Ramp 1 | 21:50–23:20 May 9 | 1h 30m | ~155k | ramping | ~3,400 | — |
| Phase 1 plateau (main flood + solver) | 23:35 May 9 – 06:05 May 10 | 6h 30m | ~600k (peak 672k) | ~1,276 rps | ~2,400 | ~0.51 rps/IP |
| Phase 1 cliff | 06:20 May 10 | 15m | 90k | (transitioning) | 1,634 | — |
| Phase 2 solver-only | 06:30 – 09:30 May 10 | 3h | ~520 (all bypass-path) | ~520 rps | ~135 | ~3.9 rps/IP |
| Phase 3 brief spike | 09:45 – 10:00 May 10 | 15m | ~10k (mostly fwc-blocked) | ~17–144 rps | varied | — |
| End | 10:15 May 10 | — | 0 | 0 | — | — |
The Phase 1 → Phase 2 transition is the most analytically interesting handover. In a single 15-min bucket, edge volume dropped from 594k to 90k req/s and Cloudflare’s L7 DDoS rule (which had been handling 99% of traffic) returned zero requests in the next bucket. Cloudflare’s HTTP DDoS Attack Protection managed ruleset is threshold-based — mitigations are applied when the per-rule sensitivity threshold (default: high) is exceeded — so the simplest reading consistent with the data is that the rule’s triggering condition stopped being met when the volumetric component ended; we infer this from the observed pattern, not from Cloudflare directly logging a rule state change. But traffic through Cloudflare’s per-site challenge layer (securitylevel) did not drop with it: that path continued at ~520 rps (roughly 470,000 requests per 15-min bucket) for the next three hours, almost entirely consisting of challenge-solver requests reaching origin. The fleet behind Phase 2 shrunk to about 5% of the Phase 1 fleet by IP count (~135 vs ~2,500 concurrent), but per-IP it hit roughly 7× harder through the solver path (~3.9 vs ~0.5 rps/IP at the bypass layer). The volumetric Phase 1 component was the part Cloudflare blocked; the solver Phase 2 component is what kept origin in failure throughout.
Origin began HTML recovery around 10:15 — approximately 45 minutes after Phase 2 ended at 09:30 and ~15 minutes after the brief Phase 3 spike at 09:45–10:00 ended. The relatively quick recovery (once the attack genuinely stopped) is direct evidence that the failure was caused by ongoing attack pressure, not by lingering server-side damage requiring extended recovery.
Active IP pool during Phase 1 averaged ~2,400 concurrent IPs per 15-min window, against 31,293 unique IPs seen across the full campaign — confirming heavy rotation through a larger pool. Per-IP sustained rate at the edge during Phase 1 works out to roughly 214 req/s per IP, which is fast but not extreme for a dedicated DDoS tool on a fast-uplink hoster.
Recon during attack: filtering the host-wide URL breakdown to typical reconnaissance paths (wp-login.php, .env, .git/, xmlrpc.php, wp-config*, .aws/credentials, phpmyadmin) yields 2,657 requests across 31 URLs over the full 13-hour window. This is background internet-noise level: the bulk of it is the perennial 2,360 hits against /wp-login.php, evenly distributed in time. The attacker did not use the flood as cover for application-layer probing. Pre-attack reconnaissance — whether the operator scoped the target before launching — is outside the scope of this export and we make no claim about it.
Real-reader impact (measured)
A 15-minute timeseries filtered to non-attack non-cdn-cgi/* URLs, broken down by cacheStatus × edgeResponseStatus × contentType, gives a direct measurement of what real readers experienced. We focus on HTML responses as the cleanest proxy for “did a reader actually load a page?” — static assets (CSS, JS, images, fonts) can serve from cache independently of HTML availability, but a reader cannot meaningfully consume the site without the HTML page itself loading. Across the full 13-hour export window the filter produced 50,778 HTML requests. The headline observations:
- Zero HTML pages were served from edge cache with status 200. Across the entire 13-hour window,
cacheStatus: hitHTML responses returned 404 (4,001 cached negative responses for non-existent paths) — but never a 200. Cloudflare does not cache HTML page responses for pozirk.online by default (typical for a WordPress site), and stale-if-error caching was not configured. There was no graceful-degradation fallback for HTML. - Two denominators matter here, and we report both. (a) Observed non-attack HTML requests during the 12-hour attack window: 47,144, of which 40,790 (86%) were
cacheStatus: nonereturning 403 — these are WAF-blocked scanner/probe traffic, not reader attempts, and we exclude them from reader-experience figures. (b) Origin-dependent reader-like HTML attempts (origin-touching cache states:miss/expired/revalidated/dynamic/bypass): 2,359 across the attack window. The reader-experience success rate is computed only on (b). - Among origin-dependent reader-like HTML attempts, 57 succeeded (~2.4%), and effectively zero through the core of the outage. 56 of those 57 successes fell in the single 22:00 bucket as origin was collapsing; the only other was a lone success at 10:00 as recovery began. From 22:15 May 9 through 10:00 May 10 — a continuous ~11.5-hour zero-success interval — not a single reader-like HTML request returned 200. (The pre-attack baseline for the same denominator was 34–65% success.)
- Static assets (CSS, JS, images, fonts) continued serving from edge cache. Of the 6,702 total cache-hits across all content types, 4,001 were HTML 404s, and the remaining ~2,700 were static assets served as 200 or 304. A reader whose browser landed on the site would have received those — but without the HTML page that loads them, they served no purpose. The site’s chrome was technically reachable; the content was not.
- Recovery began around 10:15, not earlier. The first reader-like HTML success after 22:15 was a single 200 at 10:00 (1 of 39 origin-touching attempts); the 10:15 bucket reached 37 of 134 (≈28%) — the first meaningfully recovered bucket — about 45 minutes after the Phase 2 solver continuation ended at 09:30 and ~15 minutes after the brief 09:45–10:00 residual spike. We describe 10:15 as the start of recovery, not as “fully healthy”; later post-window buckets would be needed to confirm a return to normal reader success rates. Outage span depends on definition: zero-success interval 22:15–10:00 (~11h 45m); first meaningful recovery at 10:15.
Per-15-min HTML reader experience during the attack window (denominator: origin-dependent reader-like HTML requests only — WAF-blocked scanner 403s excluded):
Time         HTML tot   200s     5xx   200%   notes
21:30 (pre)      1377    465       0   33.8%   pre-attack baseline
21:45 (pre)      1307    848       0   64.9%   pre-attack baseline
22:00 (P1 on)     549     56     343   10.2%   origin collapsing
22:15             505      0     468    0.0%   origin failing
22:30             592      0     592    0.0%
...              (every bucket 22:15–09:45: 0 reader-like HTML successes)
09:30 (P2 end)     15      0      12    0.0%   solver continuation ends
09:45              20      0       3    0.0%   no recovery yet
10:00              39      1      38    2.6%   first 200 since 22:00
10:15             134     37       7   27.6%   recovery begins
(The “pre-attack baseline” rows show 34–65% success on this origin-dependent denominator; that is the normal range for this measurement, which mixes genuine reader page-loads with origin-touching crawler/feed traffic, and is not a claim that a third of human visitors normally fail.)
The combined observation: Cloudflare’s L7 DDoS engine kept the bulk of Phase 1’s flood off origin, and edge cache continued serving static assets, but origin’s reader-like HTML page-serving capability was effectively zero for ~11h 45m (zero-success interval 22:15 May 9 – 10:00 May 10, with recovery beginning at 10:15). For a publishing site whose business is HTML article pages, this is a complete operational outage for the duration. Real readers attempting to load any article page would have hit a Cloudflare challenge page, a 5xx error, or — if they were on a page the browser already had open with assets cached — a partially-rendered shell that couldn’t fetch any new content.
Mitigation pipeline
Cloudflare’s WAF processes incoming requests through a sequence of rule categories. Each request is tagged with the rule layer that ultimately matched it (securitySource) and the resulting HTTP status:
| securitySource | Eyeball requests | Share | Dominant status |
|---|---|---|---|
l7ddos (Cloudflare’s adaptive L7 DDoS engine) | 14,294,455,267 | 99.43% | 403 (block) |
securitylevel (per-site security level + managed challenge) | 43,565,957 | 0.30% | 502 (96%), 403 (3%) |
firewallCustom (site-specific custom rules) | 35,643,064 | 0.25% | 403 (100%) |
unknown (uncategorised; small residual after Early Hints removed — not characterised) | 3,433,799 | 0.02% | — |
| Eyeball total (by mitigation source) | 14,377,098,087 | 100.00% |
Two things worth flagging. First, the eyeball total above is reconciled against Cloudflare’s dashboard widget (“Total Requests: 14.38B”), which excludes Cloudflare’s internal HTTP 103 Early Hints traffic. The GraphQL Analytics API also returns ~978M Early Hints events (under securitySource: unknown with status 504 and UA nginx-ssl early hints); we strip them from the eyeball total but they are visible in raw GraphQL pulls. The mitigation-source breakdown above sums to ~46k more than the UA-stripped headline figure (14,377,052,513) because of bucket-edge rounding in the securitySource × status × time table; the discrepancy is <0.0004% and does not affect any percentage in this report.
Second, the small securitylevel slice (0.30%) is the operative bypass path — traffic that reached past the L7 DDoS layer into the per-site challenge layer. Of that slice:
- 94.3% of samples passed the managed challenge (
securityAction: managed_challenge_bypassed) — roughly 41 million eyeball requests over the attack window. - 98.7% of those that solved the challenge reached origin (sample field
originResponseStatusis non-zero), and origin itself returned 502 to virtually all of them. This is origin failure, not Cloudflare-side blocking: the requests were forwarded past Cloudflare’s edge as legitimate verified-browser traffic. - The sustained rate at origin from the solver cohort works out to roughly 1,276 rps during Phase 1’s 8.5h plateau and ~520 rps during Phase 2’s 3h continuation — more than sufficient to keep a typical WordPress origin in continuous failure state for the entire 12h campaign.
- Across the whole attack, the count of HTTP 200s differs by which population you measure, so we label each: 127 HTTP 200s on the attack paths themselves (“/” + “/ru/”, from the eyeball mitigation data); 57 successful origin-dependent reader-like HTML page loads on non-attack URLs (the reader-experience figure, see Real-reader impact); and 1,534 HTTP 200s among all origin-contacted HTML requests host-wide (the origin-health measurement, see Origin failure pattern). All three are small fractions of their respective denominators — origin was failing, not merely slow.
Operationally: Cloudflare’s edge stopped 99.43% of Phase 1’s flood from reaching origin. The 0.286% bypass cohort that did reach origin was sufficient on its own to hold origin in continuous 5xx failure, and Phase 2 demonstrated this directly — when the L7 DDoS-blockable bulk of Phase 1 stopped at 06:30, the solver-only continuation kept origin pinned for another three hours using just ~135 active IPs. Reader-like HTML page loads were effectively zero from 22:15 May 9 through 10:00 May 10 — only 57 origin-dependent reader-like HTML successes across the whole attack window, nearly all of them in the first 30 minutes before origin fully collapsed (plus one as recovery began at 10:00). Edge cache continued serving static assets (CSS, JS, images) but did not serve HTML pages (HTML caching was not configured), so real readers attempting to load article pages received either a Cloudflare challenge page or a 5xx error. Zero-success interval: ~11h 45m (22:15–10:00); recovery began at 10:15.
Leak rate over time was steady at 0.17–0.42% of total traffic for the Phase 1 plateau, with no growth and no observable attacker adaptation. After 06:30, the securitylevel path becomes the dominant remaining attack traffic — but this is a denominator change (the volumetric l7ddos-blocked component stopped), not a deterioration in Cloudflare’s L7 DDoS rule. The absolute solver-path rate in Phase 2 (~523 rps to the bypass layer, ~520 rps reaching origin) was below Phase 1’s (~1,223 rps to bypass, ~1,276 rps origin-touching), but remained sufficient to hold origin at ~0% HTML success. This is a sustained second phase, not a tail-noise artefact.
Protocol fingerprint: 100% HTTPS, ~99.7% HTTP/2 (0.3% HTTP/1.1, 0.03% HTTP/3), 99.98% TLS 1.3. 100% GET method (3 stray POSTs in 14B requests). The attack requests to “/” and “/ru/” were effectively no-query. The separate query-string breakdown (93 distinct values host-wide) is dominated by Cloudflare’s own /cdn-cgi/images/*?<nonce> challenge-asset cache-busters and a handful of ?author=N background WP probes — these are not query strings on the attack paths and are filtered out of attack-path counting.
Origin failure pattern: fast-fail, not server crash
End-to-end measurement of origin’s response to every origin-contacted HTML request across the campaign (45,127,983 requests) shows a specific failure mode worth naming. The breakdown:
- 99.90% (45,083,313) returned 502 — proxy/upstream connection refused or failed
- 0.07% (29,806) returned 301 — redirects (served before the upstream failed)
- 0.02% (7,569) returned 500, 0.01% (4,736) returned 504 — application error / origin timeout
- 0.003% (1,534) returned 200 — origin successfully served the page
- remainder: a few hundred 404/302/400
The dominance of 502 over 504, combined with origin’s response-time distribution during the attack (avg ~140ms, p50 ~125ms, p99 ~700ms) — faster than the 1,000–1,500ms baseline — is consistent with a fast upstream/proxy/application failure mode: a front-facing reverse proxy returning 502 quickly because its upstream application pool was exhausted, refusing connections, or otherwise unavailable, rather than the origin timing out slowly while trying to render pages. The Cloudflare export does not distinguish among the specific mechanisms (e.g. process-pool exhaustion, database connection limits, or proxy-side connection refusal), and we have no origin-side logs to confirm which applied; the pattern indicates fast-fail upstream of page rendering, not which component failed. Operationally this points to the application/upstream layer rather than the front-facing web server as the thing to harden, and is consistent with the near-immediate recovery once attack pressure stopped (nothing in the data indicates a crash requiring restart).
Who solved, who didn’t
Within the bypass-path samples (securitySource: securitylevel), the solver rate varies by source in a pattern that reads cleanly as Cloudflare-side treatment, not attacker-side capability variation:
| ASN | Description | securitylevel samples | Solved (managed_challenge_bypassed) | Solver rate |
|---|---|---|---|---|
| AS6057 | Administracion Nacional de Telecomunicaciones (Uruguay ISP) | 495 | 495 | 100.0% |
| AS9299 | Philippine Long Distance Telephone Company | 488 | 481 | 98.6% |
| AS8193 | Uzbektelekom Joint Stock Company | 421 | 421 | 100.0% |
| AS45899 | VNPT Corp (Vietnam ISP) | 385 | 385 | 100.0% |
| AS25019 | Saudi Telecom Company JSC | 376 | 376 | 100.0% |
| AS7552 | Viettel Group (Vietnam ISP) | 298 | 298 | 100.0% |
| AS17639 | Converge ICT Solutions Inc. (Philippines ISP) | 296 | 292 | 98.6% |
| AS35819 | Etihad Etisalat (Saudi Arabia mobile) | 276 | 276 | 100.0% |
| (Top hosting/cloud ASNs by attack volume) | DigitalOcean, AEZA, Contabo, Google Cloud, Oracle Cloud, WorkTitans, netcup, etc. | 0 reached securitylevel in sample | — | — |
| (Tor exits, all ASNs) | — | 0 reached securitylevel | — | — |
The categorical pattern: every ASN whose traffic reached the per-site challenge layer in meaningful quantities is a residential or mobile ISP, and from those, virtually every challenge was solved. The hosting and cloud ASNs that dominate the attack by request count (the top 15 by traffic share — WorkTitans, DigitalOcean, AEZA, Contabo, Google Cloud, Oracle, Cloudflare (AS13335), netcup, OVH, HOSTKEY, Hetzner, etc.) do not appear at all in the stratified sample of the securitylevel cohort. Their traffic was matched at the l7ddos layer upstream and returned 403 directly, never reaching the challenge stage. Tor follows the same pattern. The bot software is identical across these sources (see “Coordination evidence” below); what varies is the defender’s per-source reputation classification. The most parsimonious reading is that Cloudflare’s reputation model treats known commercial hosting infrastructure as known-bad and blocks at L7 DDoS regardless of whether the bot could solve a challenge, while routing more reputable source classes (residential ISPs from countries where they’re the main internet egress) through the challenge layer — where the bot’s JS solver then succeeds at ~100%.
URL targeting × Tor: a small but clean asymmetry
The overall URL split across the attack, request-weighted from the full URL breakdown, is 99.55% “/” and 0.45% “/ru/” — the homepage was overwhelmingly the primary target. (Earlier drafts cited ~97/3 from the stratified sample; that figure is an artefact of the securitySource stratification over-weighting the small securitylevel/firewallCustom strata and should not be used — the request-weighted breakdown is authoritative.) Within the stratified sample, a qualitative asymmetry is nonetheless robust: every “/ru/” request in the sample came from non-Tor infrastructure; Tor exits hit “/” exclusively. Because the sample’s absolute URL proportions are unreliable (see above), we report this only as a directional finding — Tor traffic targeted the homepage only, while the small “/ru/” volume was entirely non-Tor — and do not put a precise percentage on the non-Tor “/ru/” share beyond the request-weighted 0.45% overall. This is consistent with internal fleet structure (a Tor-routed cohort configured with a different, homepage-only target list), though the data doesn’t establish why.
Coordination evidence
Per-IP samples were pulled in a tight 15-minute window (02:05–02:20 UTC, May 10) for 5 top IPs from each of 8 attacker ASNs spread across continents and provider types: DigitalOcean (US), AEZA (RU), Contabo (DE), Google Cloud, Oracle Cloud, Cloudflare AS13335, netcup (DE), WorkTitans (NL).
Within that slice:
- 100% HTTP/2 + TLS 1.3 for every IP in every ASN. Zero variation.
- Two and only two UA templates across all 40 IPs:
Firefox/Android 13(mean 75% per ASN) andChrome/Android 10with the “K” device placeholder (mean 25%). Mix ratio drifts by ASN within a 50–100% range, consistent with random sampling from a 2-template pool rather than per-fleet configuration. - Median 5 UAs per IP in the 15-minute window (max 10). The UA randomiser is inside each bot, not assigned per-IP.
- 100% returned 403 in this window — these IPs were sustained-rate workhorses, not the bypass cohort.
The shared protocol stack and the shared UA-template pool across IPs that have no infrastructural relationship to each other (a Google Cloud VM and a Cloudflare-AS13335 host and a netcup VPS doing the same things at the same time, in the same way) point to one bot framework being deployed across many heterogeneous infrastructures simultaneously. This is consistent with commercial DDoS-for-hire infrastructure: capacity drawn from many sources and orchestrated by a single tool. The fingerprint supports the “one tool, many infrastructures” reading; it does not by itself establish the business model, seller, or buyer.
Source attribution
The attack was sourced from 31,293 unique IPs across 4,341 unique ASNs and 203 countries. No single source dominates: the largest ASN is 3.11% of traffic; the top 10 ASNs cover 23%; the top 50 cover 49%.
Top 15 source ASNs (GraphQL request counts including ~6% Cloudflare-internal Early Hints; shares are of the GraphQL total, not the eyeball total):
| ASN | Description | Share | Type |
|---|---|---|---|
| AS209847 | WorkTitans B.V. (NL) | 3.11% | hosting |
| AS14061 | DigitalOcean | 3.00% | cloud |
| AS210644 | AEZA Group LLC | 2.79% | hosting (RU) |
| AS51167 | Contabo GmbH | 2.73% | hosting (DE) |
| AS396982 | Google LLC (Cloud) | 2.45% | cloud |
| AS31898 | Oracle Cloud | 2.40% | cloud |
| AS13335 | Cloudflare, Inc. | 2.16% | CF network (WARP + other) |
| AS197540 | netcup GmbH | 1.61% | hosting (DE) |
| AS212400 | DEDIROOM LLC | 1.57% | hosting |
| AS216071 | SERVERS TECH FZCO | 1.50% | hosting |
| AS210976 | Timeweb, LLP | 1.48% | hosting (RU) |
| AS16276 | OVH SAS | 1.44% | hosting (FR) |
| AS57043 | HOSTKEY B.V. | 1.16% | hosting (NL) |
| AS41745 | Baykov Ilya Sergeevich | 1.07% | hosting (RU) |
| AS216472 | High Speed For Internet Services L.L.C | 0.98% | ISP/hosting (UAE) |
A few notes worth flagging. AS13335 (Cloudflare, Inc.) appearing as the 7th-largest source (2.16% / 332M requests) is notable — this is Cloudflare’s own network ASN. ipinfo positively identified only 67 IPs in the attack as Cloudflare WARP (Cloudflare’s consumer VPN); the full 332M-request AS13335 slice should not be assumed to be all WARP without per-IP service confirmation, as AS13335 also carries other Cloudflare-network traffic. To whatever extent WARP was used, routing a privacy product operated by the same vendor fronting the target is noteworthy; Cloudflare’s WAF classified all of the AS13335 attack traffic as malicious (every sample returned 403). AEZA (AS210644 and the related AS216246 “Aeza Group LLC”) is a Russian hosting provider that has been named in third-party abuse reporting in connection with malicious traffic (we flag the association but the characterisation is external, not established by this dataset). Several Russian-language hosters appear in the top tail: AEZA, Timeweb, JSC TIMEWEB, Selectel, QuickSoft. No QuickPacket presence — the dominant single source in the May 17–18 attack is absent here.
Geographic distribution (request-weighted):
| Country | Share |
|---|---|
| Germany | 13.0% |
| United States | 11.8% |
| Indonesia | 9.6% |
| Netherlands | 9.6% |
| France | 5.0% |
| Finland | 3.6% |
| Mexico | 3.4% |
| Russia | 3.3% |
| United Kingdom | 3.0% |
| Singapore | 2.6% |
| Sweden | 2.6% |
| Turkey | 2.3% |
| Bangladesh | 2.1% |
| T1 (Tor exits) | 1.98% |
Tor share is 1.98% of requests, down from ~40% in the May 17–18 attack. The Tor exit operators that appeared (Stiftung Erneuerbare Freiheit, Church of Cyberology, Emerald Onion, 1337 Services, Foundation for Applied Privacy, F3 Netze, FranTech, DFRI, Unredacted Inc) are the usual set — but they are no longer a workhorse here, just a sliver of the campaign.
Datacenter distribution: 216 Cloudflare datacenters absorbed attack traffic. Top 10 absorbed 62.3% (Singapore, Amsterdam, Ashburn, Atlanta, Stockholm, Milan, Miami, Dallas, London, Hong Kong). The geographic spread on Cloudflare’s side mirrors the source-side spread.
IPv4 vs IPv6: 92.4% IPv4 / 7.6% IPv6. The IPv6 portion is dispersed across many /48s; the top IPv6 IPs are individually large (one Hetzner v6 fired 73M requests, a single AEZA-range v6 fired 70M) but there is no concentrated IPv6 fleet.
Subnet clustering
There is no equivalent of the May 17–18 attack’s QuickPacket /21 concentration. IPv6 traffic is best stated separately (it is not a /24 cluster): IPv6 total: 1.17B requests across 2,227 distinct IPs, dispersed across many /48s with no concentrated block. The largest IPv4 /24 concentrations are:
| /24 | Requests | Unique IPs in /24 | Notes |
|---|---|---|---|
| 149.18.81.0/24 | 240M | 11 | DEDIROOM LLC (AS212400) — small concentrated fleet |
| 85.8.47.0/24 | 121M | 4 | small concentrated fleet |
| 85.192.29.0/24 | 120M | 1 | single high-throughput IP |
| 138.124.87.0/24 | 113M | 1 | single high-throughput IP |
| 5.180.30.0/24 | 88M | 3 | small concentrated fleet |
| 80.150.246.0/24 | 82M | 1 | single high-throughput IP |
| 185.220.101.0/24 | 53M | 142 | Foundation for Applied Privacy (Tor exits) |
This is the long-tail pattern of a globally distributed campaign: a handful of single-IP heavy hitters firing 50–120M requests each, no large coordinated /24 blocks except for Tor’s known exit clusters.
Infrastructure composition (per-IP vs per-request)
ipinfo.io classification of all 31,293 attacker IPs vs Cloudflare’s per-request view:
| Class | Share of unique IPs | Approx share of requests |
|---|---|---|
| ISP | 82.2% | ~48% |
| Hosting | 10.3% | ~50% |
| Business | 6.6% | included above |
| Education | 0.3% | — |
| Government | 0.0% | — |
The contrast is the finding. Hosting-class IPs are only 10% of the unique IPs but produced roughly half the requests: each hosting IP averaged ~700k requests over the attack, while each ISP IP averaged ~270k. The hosting fleet was the workhorse; the ISP fleet was used as long-tail volume and footprint diversification.
Cross-cutting flags from ipinfo (these stack on top of the usage type — a given IP can be both ISP and Mobile, for example):
- Mobile: 3,173 IPs (10.1% of fleet) — flagged as carrier-mobile by ipinfo
- VPN: 2,972 IPs (9.5%)
- Hosting flag: 3,675 IPs (11.7%) — close to but not identical to the Usage Type “Hosting”
- Tor: 1,264 IPs (4.0% of IPs but only 1.98% of requests — Tor IPs were ~30% less productive than non-Tor IPs)
- Proxy: 124 IPs
Geography (IP-weighted vs request-weighted) diverges noticeably. ipinfo’s top country by unique IPs is the United States (17.2%), with India (2.7%), Bangladesh (2.2%), and Indonesia (1.9%) trailing. Cloudflare’s request-weighted view leads with Germany (13.0%), then the US (11.8%), Indonesia (9.6%) and the Netherlands (9.6%). The discrepancy is consistent with the workhorse fleet being concentrated in European and Asian hosting (high requests per IP) and the residential long tail being skewed US-heavy (many IPs, few requests each).
Privacy services
ipinfo identified five commercial privacy services in the IP pool:
| Service | IPs | Share of fleet |
|---|---|---|
| NordVPN | 319 | 1.0% |
| ProtonVPN | 309 | 1.0% |
| IPVanish | 213 | 0.7% |
| Surfshark | 133 | 0.4% |
| Cloudflare WARP | 67 | 0.2% |
Approximately 1,040 IPs (~3.3% of the fleet) were routed through identifiable consumer VPNs. The 67 Cloudflare WARP IPs are ipinfo’s positive per-IP identifications; the full AS13335 request slice (~332M) is much larger but should not be assumed to be all WARP, as AS13335 carries other Cloudflare-network traffic too.
Bot fingerprint
User-agent distribution across the 14.38B eyeball requests resolves into two large synthetic-randomiser cohorts plus a small tail:
| UA template | Versions cycled | Requests | Share of eyeball |
|---|---|---|---|
Mozilla/5.0 (Android 13; Mobile; rv:V) Gecko/V Firefox/V | 16 versions, rv 109–146 | 10,624,067,624 | 73.9% |
Mozilla/5.0 (Linux; Android 10; K) AppleWebKit/537.36 ... Chrome/V Mobile Safari/537.36 | 9 versions, Chrome 120–147 | 3,692,112,533 | 25.7% |
| Firefox/Windows + Chrome/Windows (versions 131–146) | tail | ~54M | 0.4% |
| Other (incl. benign monitors) | — | ~7M | <0.1% |
Inside each Android cohort, browser-version share is near-flat across the iterated range (Firefox 109 through Firefox 146 each contributing 580M–1.2B requests, with no skew toward currently-shipping versions). A real-traffic distribution would show heavy skew toward the current-stable version; a flat distribution spanning many old and current versions in near-equal volume is the signature of a UA randomiser iterating a hardcoded version list rather than reflecting a real browser population. (Both ranges include versions that existed at attack time — Chrome 147 reached stable in April 2026, Firefox 146 in December 2025 — so the tell is the flatness and the repetition across unrelated infrastructure, not any single impossible version.) Per-IP rotation (median 5 UAs per IP in a 15-min window) confirms the randomiser operates inside each bot instance.
Botscore disposition in samples reflects this: l7ddos 403s arrive with botScoreSrcName: Not Computed (Cloudflare’s L7 DDoS rule blocked these before the bot scoring stage ran, by design), while the small securitylevel slice that did reach scoring is tagged Heuristics or Machine Learning.
Technical interpretation
(Substantial overlap with the Summary’s “What this was, what it wasn’t” by design — this section restates the framing with citations to the supporting evidence above, so a technical reader can verify each claim end-to-end.)
What it was: an HTTP GET flood against “/” and “/ru/” of pozirk.online, delivered in two phases — an 8.5-hour volumetric Phase 1 sustained at ~512k req/s by ~2,400 concurrent IPs, and a 3-hour Phase 2 solver-only continuation by ~135 concurrent IPs pushing ~500 rps through the bypass path — plus a brief 15-min residual spike around 09:45–10:00. Total campaign duration: ~12.25 hours. Executed by ~31,000 unique IPs spread across 4,300 networks and 203 countries. The bot software is uniform across sources: 100% HTTPS, 100% HTTP/2, 100% TLS 1.3, GET-only, no query strings, two UA templates with randomised browser versions, capable of solving Cloudflare managed challenges. Sustained per-IP rate ~214 req/s at the edge during Phase 1. Non-adaptive within each phase: no probing, no protocol variation, no observed response to Cloudflare’s defences within either Phase 1 or Phase 2.
What it wasn’t: there is no evidence of application-layer customisation (no POSTs, no path probing, no query-string fuzzing, no headers attempting to evade WAF rules), no parallel reconnaissance (recon paths sat at background-noise level throughout), and no protocol-stack variation across infrastructures. The challenge-solving capability is real and was operationally decisive — the ~45M HTML requests that reached origin (at ~1,276 rps during Phase 1, ~520 rps during Phase 2) were sufficient to keep origin in continuous 5xx failure for the entire 12-hour campaign. Only 1,534 HTML responses out of those 45M attempts received a 200 from origin (0.003%), and most of those were concentrated in the first 30 minutes before origin’s application layer collapsed. Phase 2 in particular shows that the solver cohort alone — about 5% of Phase 1’s IP count — was enough to keep origin down without the volumetric front; the Phase 1 bulk that Cloudflare blocked at the edge was not load-bearing for the operational impact.
Defence outcome: Cloudflare’s adaptive L7 DDoS engine blocked 99.43% of eyeball traffic at the edge with 403 during Phase 1, preventing the bulk of the flood from reaching origin. The securitylevel leak path absorbed 0.30% across both phases, of which 94% solved Cloudflare’s managed challenge and were forwarded to origin as verified-browser traffic; origin returned 502 to virtually all of it. Customer-specific custom rules (firewallCustom) blocked another 0.25% at the edge, and during Phase 3 (09:45–10:00) absorbed most of a brief 11k-rps spike. Cloudflare’s reputation model appears to gate which sources are even allowed to attempt the challenge layer — hosting/cloud ASNs (Google Cloud, DigitalOcean, AEZA, Contabo, Oracle, WorkTitans, etc.) and Tor were caught at the L7 DDoS layer upstream and never reached the challenge stage; the ASNs whose traffic did reach the challenge layer were almost entirely residential or mobile ISPs (Saudi Telecom, VNPT, Uzbektelekom, Etihad, Philippine Long Distance), and from those, virtually every challenge was solved. The 15-minute timeseries for non-attack URLs (see Real-reader impact) measures origin’s HTML-page-serving capability at effectively zero from 22:15 May 9 through 10:00 May 10 — only 57 origin-dependent reader-like HTML successes across the whole attack window. HTML caching was not configured at edge, so cache fallback was not available for article pages (only for static assets like CSS, JS, images). The site’s content was operationally unreachable for the duration of the attack despite Cloudflare’s edge handling 99.43% of attack traffic. Origin began HTML recovery around 10:15 — approximately 45 minutes after Phase 2 ended and 15 minutes after the residual spike ended — consistent with the failure having been caused by sustained attack pressure rather than lingering server-side damage.
Operator profile: broadly distributed paid commercial DDoS infrastructure with a uniform Layer-7 toolkit. The combination of a 14B-request budget, 4,300+ source networks, IPv6 capacity, and an automated challenge-solver is consistent with a mid-to-high-tier commercial stresser service. No adaptive behaviour was observed within either phase — the UA cohorts, paths, protocol stack, and rate stayed constant from start to Phase 1 cliff, and the same fingerprint applied during Phase 2’s solver-only continuation. The Phase 1 → Phase 2 transition itself (an abrupt shift from ~2,500 active IPs at full edge rate to ~135 IPs running solver-only) was the only structural change in the campaign. Whether that transition was a deliberate change of mode or an artifact of part of the infrastructure being withdrawn is not visible in the data.
Quick reference
| Metric | Value |
|---|---|
| Target | pozirk.online (paths “/” and “/ru/”) |
| Campaign window | May 9 22:00 – May 10 10:15 (~12h 15m) |
| Phase 1 (volumetric + solver) | May 9 22:00 – May 10 06:30 (8h 30m) |
| Phase 2 (solver-only) | May 10 06:30 – 09:30 (3h) |
| Phase 3 (brief spike) | May 10 09:45 – 10:00 (15m) |
| Eyeball requests | 14,377,052,513 |
| GraphQL total (incl. Early Hints) | 15,355,407,097 |
| Peak rate | 672,021 req/s (05:05, Phase 1) |
| Phase 1 sustained rate | ~512,000 req/s (edge) |
| Phase 1 per-IP sustained rate | ~214 req/s (edge) |
| Phase 1 origin-reaching rate (HTML) | ~1,276 rps |
| Phase 2 sustained rate | ~520 rps (via solver/bypass path) |
| Phase 2 origin-reaching rate (HTML) | ~520 rps |
| Unique IPs (full campaign) | 31,293 |
| Unique ASNs | 4,341 |
| Unique countries | 203 |
| CF datacenters absorbing traffic | 216 |
| Phase 1 concurrent active IPs (mean) | ~2,400 |
| Phase 2 concurrent active IPs (mean) | ~135 |
| L7 DDoS block (eyeball) | 99.43% |
securitylevel leak (eyeball) | 0.30% |
firewallCustom block (eyeball) | 0.25% |
| HTTP 200s on attack paths (“/” + “/ru/”) | 127 |
| Weighted requests passing challenge | ~41M (0.29% of eyeball) |
| Total HTML requests origin actually processed | ~45M |
| Origin HTML 502 rate | 99.90% |
| Origin HTML 504 rate | 0.01% |
| Origin HTML 200 rate (all 12h) | 0.003% (1,534 successes) |
| Origin response time during attack (HTML p50) | ~125ms (fast upstream/proxy fail) |
| Top ASN share | 3.11% (WorkTitans B.V.) |
| Top 10 ASNs share | 23.3% |
| Tor (T1) share | 1.98% |
| IPv4 / IPv6 | 92.4% / 7.6% |
| HTTP method | 100% GET |
| HTTP version | ~99.7% HTTP/2 |
| TLS version | ~99.98% TLS 1.3 |
| UA templates | Firefox/Android 13 (74%), Chrome/Android 10 (26%) |
| Recon-during-attack requests | 2,657 (background) |
| Observed non-attack HTML requests (12h attack) | 47,144 (incl. 40,790 WAF-blocked scanner 403s) |
| Origin-dependent reader-like HTML attempts | 2,359 (WAF-blocked 403s excluded) |
| Reader-like HTML success rate, pre-attack | 34–65% (origin-touching denominator) |
| Reader-like HTML successes during attack | 57 of 2,359 (~2.4%); zero through the core outage |
| Zero-success interval (reader-like HTML) | 22:15 May 9 – 10:00 May 10 (~11h 45m) |
| First reader-like HTML 200 after collapse | 10:00 May 10 (1 of 39) |
| Recovery begins (≈28% origin-touching success) | 10:15 May 10 |
| HTML cache-hits served as 200 | 0 (HTML caching not configured on Cloudflare) |
| Static-asset cache hits served during attack | ~2,700 (CSS, JS, images — site chrome only) |