Prepared by: RESIDENT.NGO ThreatLab
Detection Date: May 17, 2026
Publication Date: June 1, 2026
Classification: Distributed Denial of Service (DDoS) Attack — Layer 7 (HTTP Flood)
Window analyzed: May 17, 20:35 → May 18, 05:35 MSK (UTC+3) · 9 hours
Target: pozirk.online, paths “/” and “/ru/”
Attack volume: ~283.3 million client requests to the two targeted paths (“/ru/”: 272.6M, “/”: 10.7M) · 1.29 TB egress · 99.80% of the host’s traffic during the window.
Data sources: Cloudflare GraphQL Analytics — timeseries at 15-minute and 1-hour granularity (including a securitySource × edgeResponseStatus time series), top-N breakdowns for the targeted paths and for the host as a whole, a securitySource-stratified sample of 45,431 requests, per-IP samples of 1,000 requests each across the five top IPs of eight key source ASNs, and ipinfo.io classification of each unique source IP. The 1-minute peak rate is read from the Cloudflare dashboard; no per-minute TSV export was used in this analysis.
Summary
RESIDENT.NGO analyzed another DDoS attack against Belarusian independent media outlet Pozirk. You can find our report on a previous much larger attack here https://resident.ngo/lab/writeups/forensic-analysis-report-of-a-ddos-attack-on-a-belarusian-pozirk-online-website-may-9-10-2026/
A Distributed Denial of Service (DDoS) attack is an attempt to take a website offline by overwhelming it with traffic. Rather than breaking into the site or stealing data, the attacker simply directs huge volumes of fake requests at it from many internet addresses at once — often tens or hundreds of thousands of bots working in parallel — so that the site’s servers cannot respond to legitimate readers fast enough, or at all. The goal is silence: a website that won’t load is a publisher that can’t publish, an election platform that can’t accept votes, an opposition outlet that can’t reach its audience.
Cloudflare is a network service that sits between visitors and a website, filtering out attack traffic before it reaches the site itself. When Cloudflare works well, most attack traffic is blocked at its edge; a sophisticated attacker, however, can sometimes get bots through these defenses and reach the origin server — the actual computer that hosts the site.
What happened
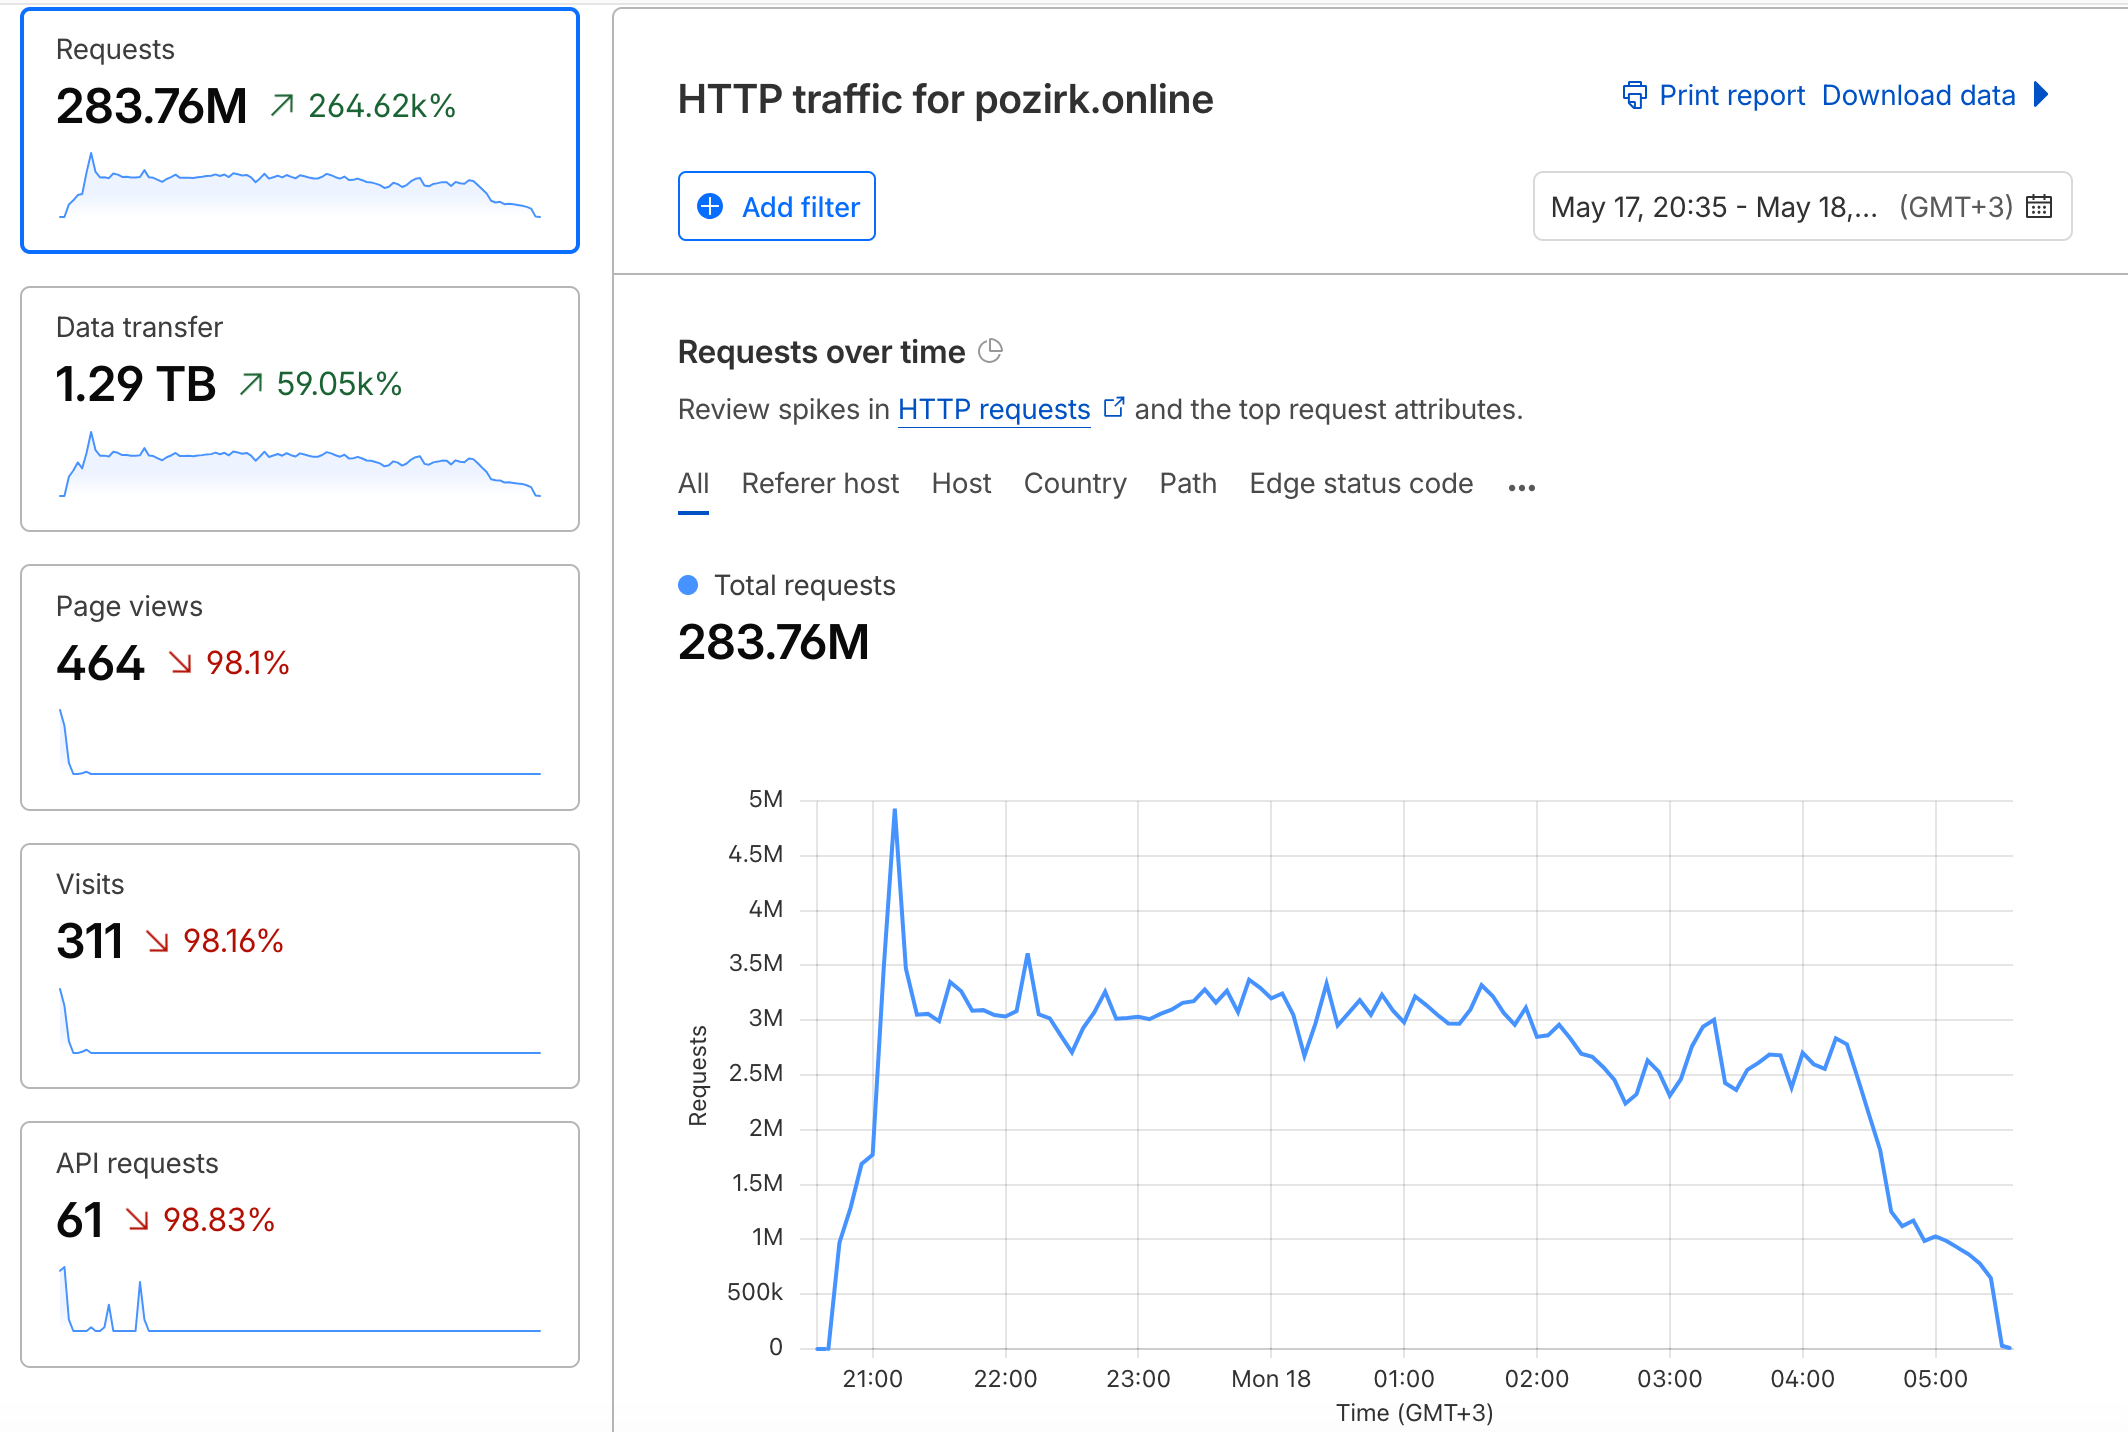
A significant DDoS attack hit pozirk.online on the night of May 17–18, 2026, lasting just over nine hours. At its peak the attackers fired roughly 80,000 requests per second at the site, and held a sustained rate of about 10,000 per second for seven hours straight — adding up to roughly 283 million requests in total. Essentially all of this traffic targeted just two pages: the site’s main page and its Russian-language landing.
Cloudflare’s defenses blocked the vast majority. Of the 283 million attack requests, only 23 ever produced a successful response from the site itself. Twelve of these came in the first half hour and were benign traffic that happened to be hitting the site as the attack started (Googlebot, an uptime monitor, security scanners). The other eleven came shortly after and were most likely attacker bots that passed Cloudflare’s automated challenge and reached the origin server before it became overwhelmed. After that, no request received a successful response for the remaining nine hours.
Key findings
A small fraction of the bots could solve Cloudflare’s automated challenges. Roughly 3% of the attack — about 8.5 million requests — came from bots sophisticated enough to pass Cloudflare’s JavaScript-based “managed challenge,” which is designed to distinguish real browsers from automated tools. These bots were then forwarded to the origin server as if they were real visitors. The origin couldn’t keep up and returned errors to all of them, but it did spend real CPU time processing each one (a median of 146 milliseconds per request, sustained for seven hours). This capability is the most distinctive technical feature of the campaign: it points at paid commercial DDoS infrastructure rather than a free or low-end attack tool.
The attack was distributed across ~12,300 different IP addresses, with about 1,500 of them active at any given moment, each firing roughly 6 requests per second. The bots came from very different kinds of internet infrastructure — about a third from Tor exit nodes, a third from a single US-based bulk hosting company (QuickPacket, LLC), and the rest from mainstream cloud providers (Alibaba, Tencent, DigitalOcean, Oracle, and others), commercial VPN services (ProtonVPN, NordVPN, even Cloudflare’s own WARP service), and a long tail of residential and business internet connections in 161 countries.
About 40% of the attack came through the Tor anonymity network, which is unusual for this kind of attack. Most commercial DDoS services avoid Tor because its capacity is limited and easily blocked. Seeing such a large Tor share suggests an attacker with non-standard tooling and large-scale use of anonymity infrastructure.
Cloudflare treated different sources very differently. The single largest source — QuickPacket — contributed about a third of all attack requests, but not a single one of its IPs solved a challenge. The pattern is consistent with QuickPacket being treated as low-reputation, or rule-blocked before the challenge stage, so its traffic never got the chance to attempt one. By contrast, traffic from major cloud providers and national residential ISPs reached the solved-challenge path at 2–12% rates. The hierarchy — bulk hosters at 0%, Tor exits and second-tier clouds at 2–5%, trusted ISPs and major clouds at 8–12% — points to Cloudflare’s reputation system, rather than the attacker’s bot software, determining who got through. The same tool ran everywhere; only the infrastructure it ran on varied in how Cloudflare treated it.
The attacker did not adapt during the nine hours. Despite getting essentially nothing through — about 93% of traffic was blocked at Cloudflare’s edge, a further ~4.5% reached the origin server only to fail with errors, and just 23 requests out of 283 million produced a successful response — the attacker made no observable change to their tactics: no rotation of user agents, no shift in target pages, no change in protocol, no rate adjustment. The campaign’s shape is consistent with a scheduled DDoS-for-hire run rather than a live operator adjusting tactics in response to defenses.
Attribution
The technical data does not identify who carried out this attack. What we can say is the following, and we are careful to separate fact from suspicion:
- The attack began on the evening of May 17, 2026, approximately 26 hours after Pozirk published articles in Belarusianhttps://pozirk.online/be/news/187790/ and Russian https://pozirk.online/ru/news/187796/ covering the ongoing elections to Belarus’s Coordination Council — the country’s main democratic opposition body operating in exile.
- The Coordination Council’s own voting infrastructure was, at that exact time, already under a separate sustained DDoS attack that had disrupted the start of voting on May 11 and continued through the election period. Pozirk’s articles reported on this.
- Pozirk is an independent Belarusian publication that has covered the democratic opposition and government repression in detail, and has previously experienced cyberattacks.
The simultaneity with the attack on Coordination Council infrastructure, the timing relative to publication about that election, and Pozirk’s editorial profile are consistent with the editorial office’s suspicion. The editorial office suspects that the attack was initiated by an actor connected to the Belarusian state, or to interests aligned with it. This is consistent with the attack’s overall shape — a paid commercial DDoS service can be hired by anyone with money and motive — but the technical data alone neither confirms nor rules out this attribution. We present it as a reasoned suspicion based on context, not as a forensic conclusion.
What this was, and what it wasn’t
In plain summary: this was a substantial, professionally-operated DDoS attack against an independent news site, carried out using paid commercial infrastructure with non-trivial capabilities (challenge-solving bots, mixed Tor and hosting sources, ~1,500 coordinated workers). It was not a sophisticated attempt to break into the site, steal data, or disrupt specific functionality — the flood was aimed squarely at two pages, with no sign of a coordinated effort to map the site’s structure or exploit vulnerabilities (beyond the low level of automated scanning every public website constantly receives). The goal was straightforward: drown the site in noise and make it unreachable. Cloudflare’s defenses absorbed almost all of it, but the small successful fraction was enough to put real strain on the origin server for the duration of the attack.
The remainder of this report documents the technical analysis behind these findings for researchers, defenders, and journalists investigating similar attacks.
For technical readers
Timeline
| Phase | Time (MSK) | Behavior |
|---|---|---|
| Pre-ramp window | 20:35 – 20:50 | ~70K req/min in the 15 minutes before the attack started (this is the only pre-attack data in the export, so it’s a snapshot rather than a representative baseline) |
| Ramp | 20:50 – 21:20 | Climbs from 335K → 660K req/min over 30 min |
| Sustained flood | 21:20 – 04:30 | ~600K req/min ± 10% for 7 hours, ~1,500 active IPs per window |
| Decline | 04:30 – 05:30 | Tapers to baseline; the leak path lingers longest (see below) |
The shape — fast onset, flat top, slow decay — is consistent with a scheduled, pre-paid botnet run. There is no sign of the attacker adapting during the event: no user-agent rotation change, no path change, no method change, no rate adjustment after Cloudflare started returning 403s.
Two things in the referer log are worth noting. First, 10,104,749 attack requests — about 3.5% of attack volume — carried the referer https://www.google.com/. A bare-root Google referer like this is not what a real Google-search-results click produces (those have a /search?q=... path). It’s a plausible-looking value injected by the bot software to mimic search-driven traffic. This is another fingerprint of the underlying tool, alongside the synthetic UA distribution. Second, a small curiosity: 59 requests carried the referer https://check-host.net/check-report/3ff94d4fk94a — a public uptime-checking service. Someone outside the attack was watching whether the site had gone down.
Reconnaissance during the attack window
A cross-check across all paths to the host during the same 9-hour window found roughly 9,034 reconnaissance-style requests — WordPress probes, “/.env” scans, “/.git/*” probes, and similar — against the 290M attack requests. This is at typical internet-background levels: every public website receives a low constant rate of this kind of automated scanning regardless of whether it’s under attack. The available aggregate data does not show a target-specific probing campaign tied to the DDoS fleet, but it also isn’t granular enough to attribute these scans to specific sources — so the most we can say is that the flood was not accompanied by a visibly elevated or coordinated reconnaissance effort against the site’s real content structure.
The data exported here covers only the attack window itself; whether the operator scanned the site in the hours or days before the flood is outside its scope.
How Cloudflare classified and mitigated it
The 15-minute time series broken down by securitySource and edgeResponseStatus gives a clean view of every request’s path through Cloudflare’s stack. The shares below are computed against the 290.08M total events in the GraphQL data. Of those, ~6.8M are Cloudflare-internal HTTP 103 Early Hints traffic (UA nginx-ssl early hints) that the dashboard excludes from its “Total Requests” widget; the remaining ~283.3M is the client-attack volume the dashboard reports.
| Path | Requests | Share | Outcome |
|---|---|---|---|
l7ddos rule → 403 challenge | 246.4M | 84.9% | Blocked at edge, origin untouched |
firewallCustom rules → 403 | 23.4M | 8.1% | Blocked at edge, origin untouched |
securitylevel → 502 (sustained leak) | 8.5M | 2.9% | Solved managed challenge, reached origin, origin returned 502 |
unknown → 502 (early leak) | 4.7M | 1.6% | Real attacker requests that reached origin early in the attack before Cloudflare’s classification settled; origin returned 502. All in the first two 15-min buckets. |
unknown → 504 (Early Hints) | 6.8M | 2.3% | Cloudflare-internal HTTP 103 traffic — nginx-ssl early hints UA, not client requests. Excluded from the dashboard’s “Total Requests.” |
| All paths → 200 | 23 | <0.00001% | Successful responses — split between an early benign-traffic cluster and a small attacker-success cluster shortly after (see below) |
Cloudflare’s own l7ddos engine — its purpose-built Layer 7 DDoS detection — handled 85% of the attack by itself. Combined with the custom firewall rules, 93% of attack requests were blocked at the edge without ever touching origin. The remaining 4.5% (8.5M sustained securitylevel leak + 4.7M early unknown leak = ~13.2M total 502s) reached the origin server, which returned 502 to all of them.
The challenge-solving cohort
About 3% of attack traffic (8.5M requests) reached origin, and this is the most consequential finding in the report: those requests are tagged in Cloudflare’s data with securityAction: managed_challenge_bypassed, which means Cloudflare did issue them a managed challenge, and they passed it. The challenge-bypassed cohort then reached origin as legitimate-looking clients, with requestSource: eyeball and full origin processing (origin response duration: median 146 ms, max ~1.5 s before origin returned 502 Bad Gateway).
So the bots in this cohort weren’t “missed by the WAF” — they were sophisticated enough to solve Cloudflare’s JavaScript managed challenge automatically. The UAs in this cohort are the same five Chrome 140–144 strings used across the rest of the attack — meaning a meaningful portion of the same bot software shipped with managed-challenge-solving capability built in.
The 23 successful responses
Out of 290M total events, just 23 returned a 200 status. The breakdown by time and securitySource:
- 17:30–17:45 UTC bucket (20:30–20:45 MSK): 11 ×
unknownsource → 200. These were benign traffic that happened to be hitting the site at attack onset: Googlebot (×2), an Hetzner-hosted uptime monitor (×3),WP-Safe-Scanner/2.0, a Facebook iOS app, a Yandex Browser, and a handful of legitimate-looking Chrome/Firefox requests from European hosting IPs. All 11 appear in the stratified sample, timestamped 17:35:07–17:43:29 UTC. - 17:45–18:00 UTC bucket: 1 ×
unknownsource → 200. Not in the sampled subset. - 18:00–18:15 UTC bucket (21:00–21:15 MSK): 11 ×
securitylevelsource → 200. These aresecuritylevel-classified requests that returned 200 — most likely part of the challenge-passed path (the samesecuritylevelsource that produced the 8.5M managed-challenge-bypassed 502s), meaning attacker bots that both passed the challenge and got a response from origin before it was overwhelmed. They were not captured in the sampled rows, so we can’t confirm their UA/ASN directly; the classification is the basis for reading them as attacker traffic rather than benign. After this 15-min bucket, no further request received a 200 for the remaining ~8.5 hours; origin’s failure mode shifted to 502 across the board.
So the report should be read as: the defense let through a tiny number of requests during the first ~30–45 minutes of the attack — 12 benign, 11 likely challenge-passed attacker requests — and after that locked the site down completely against successful responses.
Who solved, who didn’t
Decomposing the overall solve rate by source ASN reveals a categorical pattern, not a uniform distribution. The “attack volume” column is the canonical ASN total from the request logs. The “solved-challenge leak rate” is the share of that ASN’s attack volume that ended up in the solved-challenge (managed_challenge_bypassed) path — computed from the stratified sample, reweighted to account for the equal-budget sampling across mitigation paths. It is not a pass rate among only the requests that received a challenge; it is the fraction of all the ASN’s requests that came out the solved-challenge end.
| ASN | Attack volume | Solved-challenge leak rate (% of ASN volume) |
|---|---|---|
| QuickPacket, LLC (US) | 97.5M | 0.00% |
| Stiftung Erneuerbare Freiheit (Tor) | 18.0M | 4.04% |
| Church of Cyberology (Tor) | 17.5M | 3.41% |
| Alibaba (US) | 16.9M | 4.05% |
| QuxLabs (Sweden) | 8.8M | 2.84% |
| Siamdata (Thailand) | 8.7M | 7.53% |
| Foundation for Applied Privacy (Tor) | 7.1M | 3.55% |
| Emerald Onion (Tor) | 6.6M | 5.41% |
| 1337 Services (Tor) | 5.8M | 2.39% |
| Tencent | 5.7M | 5.77% |
| Vietnam Posts and Telecommunications | 2.7M | 12.48% |
| Oracle Cloud | 2.7M | 7.85% |
QuickPacket is the standout. 97.5 million requests — about a third of the entire attack — produced zero solved challenges. Not “few”; zero. Across every other significant source, between 2% and 12% of requests entered the solved-challenge path. The pattern is consistent with QuickPacket’s 154.30.104.0/21 range (where the attack’s IPs concentrated, especially in .109.0/24 and .110.0/24) being treated as lower-reputation or rule-blocked before the challenge stage, so its traffic never gets the opportunity to attempt a challenge. The bot software is presumably the same; the difference is in how Cloudflare treats the source.
Tor is over-represented among solvers (~54% of solver-cohort samples vs. ~40% of attack overall). This is counterintuitive — Tor’s added latency should make JavaScript challenges harder to complete, not easier — but it follows directly from QuickPacket’s exclusion. Once the largest non-solving source is filtered out, Tor mechanically becomes a larger share of what remains.
Residential ISPs and major clouds show the highest leak rates: Vietnam Posts and Telecom (12.5%) is a national telecoms backbone whose IP ranges Cloudflare’s reputation model would treat more favourably than known-bad VPS hosters; Oracle (7.9%) and Siamdata (7.5%) sit just behind. The hierarchy — bulk hoster (0%) → Tor exits and second-tier clouds (2–5%) → trusted ISPs and major clouds (8–12%) — is consistent with Cloudflare’s per-source reputation, rather than the bot software’s varying capability, determining who reaches the challenge stage.
Time dynamics
The challenge-solving cohort held steady at ~218K requests per 15 minutes (coefficient of variation 16%) for seven hours of the sustained phase. Then, starting at 04:45 MSK, l7ddos volume collapsed (5M → 1.6M → 580K → 0 over four buckets) while the challenge-solving cohort grew in absolute terms (225K → 476K → 602K → 706K). In the wind-down, the QuickPacket-dominated portion of the fleet — whose requests were uniformly rule-blocked by l7ddos — stopped before the rest of the fleet did, leaving only the challenge-solving traffic (which comes from non-QuickPacket sources) running for the final 45 minutes. This is not a “two-software” story: the bot tool appears to be the same everywhere (see “One tool, many infrastructures” below); what differs is whether Cloudflare’s per-source reputation lets that tool’s challenge-solving capability be exercised at all.
For the site operator this is a much harder problem than a simple WAF tuning gap: managed challenge is one of Cloudflare’s stronger mitigations and these bots passed it. Closing the gap likely needs stricter measures — Bot Fight Mode, JavaScript fingerprinting via Cloudflare’s Bot Management addon, or hard-blocking the specific UA + ASN combinations seen in the cohort.
Protocol fingerprint
Essentially every sampled request was an HTTP/2 GET over TLSv1.3 to a bare HTML path with no query string. Exceptions across the 45K-record stratified sample are negligible (34 HTTP/1.1 requests, 0 POSTs); across all 290M attack events the full TSV contains exactly 7 requests with non-empty query strings. Real bot fleets often span multiple protocol versions because they’re assembled from compromised devices with varying TLS stacks. This one is uniform — consistent with a single attack tool running on hosted infrastructure rather than a residential-malware botnet.
Collateral damage
Across the 9-hour window, the host served roughly 19,000 requests to real article pages (“/ru/news/“, “/ru/longreads/“, etc.) and another ~18,000 to other content paths — most of those small bots and scanners rather than humans. Real users who tried to visit “/ru/” during the flood would have received either a 403 challenge or a 502 timeout depending on which path their request followed; once challenged, they could complete the JavaScript challenge and proceed, but the experience was degraded.
One tool, many infrastructures
Per-IP sampling across eight different ASNs — Tor exits (Foundation for Applied Privacy, Church of Cyberology, Emerald Onion, Stiftung Erneuerbare Freiheit), US bulk hosting (QuickPacket), data-center providers (QuxLabs), and Asian cloud (Alibaba, Siamdata) — was used to test whether this campaign came from one coordinated tool or from multiple buyers pointing different stressers at the same target. Five IPs were sampled per ASN, 200 records each.
The result: every fleet shares the same software fingerprint at the individual-IP level. Specifically:
Per-IP UA rotation. Every sampled IP across every ASN rotates between two or three of the five Chrome UAs (140-144) within its 200-record sample. Example: QuickPacket IP 154.30.110.101 shows 130 requests as Chrome/140 and 70 as Chrome/144; Tor exit 185.220.101.7 shows 107 Chrome/143 and 93 Chrome/141; Alibaba IP 8.219.250.122 shows 103 Chrome/141, 62 Chrome/144, 35 Chrome/143. The rotation happens inside each bot, not across bots — which means the bot software itself randomises its UA on each request from a list of five.
Effectively identical protocol stack. Essentially every request across every fleet uses HTTP/2 over TLSv1.3 with GET method and a bare path; HTTP/1.1 and non-empty query strings are statistically negligible. No fleet shows a meaningfully different combination.
Mitigation outcomes are similar at the surface but differ at the margin. Most of every fleet’s requests are blocked at the edge with 403 (via l7ddos or firewallCustom rules). The sharper differentiation lives in the small fraction that wasn’t rule-blocked outright: there, the per-source solver rate ranges from effectively zero (QuickPacket, on 97.5M requests) to 12.5% (Vietnam Posts and Telecom) — see “Who solved, who didn’t” above. The detection engine’s first-pass treatment of the fleet is broadly uniform; its second-pass behaviour (whether a request gets a challenge attempt) is reputation-gated.
Where the fleets differ. The exact mix of the five Chrome UAs varies slightly between ASNs (e.g. Stiftung Erneuerbare Freiheit’s 60729 leans on Chrome/141 at 58%, while Siamdata leans on Chrome/142 at 58%). This is consistent with the same UA-randomiser running with different seeds in different fleet partitions — not different tools. The Jensen-Shannon distance between any two ASNs’ UA distributions is 0.10–0.46, well within the range you’d expect from independent random samples of the same five-element distribution.
The conclusion: this was one operator running one tool, distributing the load across rented capacity from at least eight distinct providers. The per-IP samples don’t replace JA3 fingerprinting, but they’re a strong substitute: it would be much harder to produce these identical behavioural patterns across Tor, US hosters, and Asian clouds without a single coordinating tool.
Who was the botnet
The Tor component (39.7%)
Every confirmed Tor exit operator’s ASN appears in the top 25:
| Operator | ASN |
|---|---|
| Stiftung Erneuerbare Freiheit | 60729 |
| Church of Cyberology | 215125 |
| Foundation for Applied Privacy | 208323 |
| Emerald Onion | 396507 |
| 1337 Services GmbH | 210558 |
| F3 Netze e.V. | 205100 |
| FranTech Solutions | 53667 |
| Föreningen för digitala fri- och rättigheter (DFRI) | 198093 |
Cloudflare’s T1 country code accounts for 115.2M requests / 39.72% of the total.
A 40% Tor share is unusual for a commodity DDoS. Most stresser-as-a-service products avoid Tor because exit-node bandwidth is finite and easily blocked.
The QuickPacket workhorse (33.6%)
The single largest ASN by request volume is not Tor: AS46261, QuickPacket, LLC — a US bulk hoster — contributed 97.5 million requests (33.6% of total). The IPs came from QuickPacket’s 154.30.104.0/21 allocation (specifically including 154.30.109.0/24 and 154.30.110.0/24, the two /24s where activity concentrated most), with 200 distinct IPs participating across the parent /21. Every QuickPacket request in the sample is sourced from US.
Two hundred IPs delivered nearly 100 million requests — approaching the volume of the entire Tor component (115.2M). QuickPacket is a US-based bulk VPS provider; the campaign spun up roughly 200 of their IPs and ran them flat-out for the duration of the attack.
The cloud-provider tail
| ASN | Operator | Share |
|---|---|---|
| 45102 | Alibaba (US) Technology | 5.8% |
| 214503 | QuxLabs AB | 3.0% |
| 56309 | Siamdata Communication (Thailand) | 3.0% |
| 132203 | Tencent | 2.0% |
| 31898 | Oracle Cloud | 0.9% |
| 14061 | DigitalOcean | 0.8% |
The top 10 ASNs cover 66% of all traffic; the top 50 cover 89%.
Infrastructure composition (per ipinfo.io classification)
Cross-referencing the 12,314 distinct source IPs against ipinfo.io’s classification database gives a second perspective on the campaign’s footprint. The picture here differs sharply from the request-weighted view above because some classes of IP (notably hosting providers like QuickPacket) produced enormous request volume per IP while others (residential ISPs) contributed many distinct IPs at a low rate each.
| IP class | IPs | % of IPs | Notes |
|---|---|---|---|
| ISP-registered | 7,526 | 61.1% | Includes residential broadband, regional ISPs, and many Tor exit operators that register as ISPs for legitimacy. Not a clean “residential users” bucket. |
| Hosting (VPS/cloud) | 3,314 | 26.9% | Bulk-hoster footprint. QuickPacket (200), Alibaba, Tencent, DigitalOcean, Oracle, etc. |
| Business | 1,287 | 10.5% | Corporate internet — likely some Education and Government overlap with this. |
| Education | 55 | 0.4% | Trivial; mostly campus networks used as exit points. |
| Government | 2 | 0.0% | Statistically zero. |
The above is the primary usage classification (one per IP) and sums to ~99% of the 12,314 distinct IPs. Cross-cutting flags can stack on top of these:
| Flag | IPs | % of IPs | What it means |
|---|---|---|---|
| Hosting infrastructure | 3,902 | 31.7% | Cross-cutting Hosting flag — larger than the primary “Hosting” classification because some IPs that are primarily classified as ISP or Business are also flagged as hosting-adjacent. |
| Tor exit | 1,180 | 9.6% | ipinfo’s own Tor flag. Note: Cloudflare’s T1 country accounts for ~40% of requests, while Tor is only ~10% of IPs — meaning each Tor IP carried ~6× the load of a non-Tor IP on average. |
| Commercial VPN | 1,649 | 13.4% | IP belongs to a known commercial VPN provider. |
| Open proxy | 323 | 2.6% | Public proxy infrastructure. |
| Mobile carrier | 586 | 4.8% | IP is on a mobile network. Top carriers seen: Orange, Vinaphone, O2, Al Jawal (STC), Odido. |
| Anycast / Bogon / Relay | 0 | 0.0% | None — all addresses are real, single-located, non-bogon. |
The two most analytically important observations:
- The footprint and the load do not match. Hosting-flagged IPs are 31.7% of distinct sources but produced well over half the request volume; QuickPacket alone is 200 IPs (~1.6% of the IP pool) producing 33.6% of requests. Tor IPs are ~10% of sources but ~40% of requests. Conversely, the ~7,500 ISP-classified IPs and ~1,650 commercial-VPN IPs together account for the majority of distinct sources but a minority of volume.
- Geographic distribution by IP differs from geographic distribution by request volume. Cloudflare’s request-weighted country totals put the US at 34% and Singapore at 7%. ipinfo’s IP-weighted view puts the US at 11.8%, Brazil at 6.6%, Netherlands at 4.9%, Germany at 4.2%, and Indonesia at 3.3%. Frankfurt and Amsterdam appear in the top cities (data-center hubs for Tor exits and European VPS), Ashburn appears (QuickPacket’s home), and the rest are major data-center cities worldwide.
Privacy services and notable anonymisation infrastructure
422 IPs (3.4%) belong to identifiable commercial VPN or proxy services. A meaningful portion of the remaining ~1,200 VPN-flagged IPs are on smaller or private providers that ipinfo cannot label.
| Service | IPs | % of IPs |
|---|---|---|
| ProtonVPN | 226 | 1.8% |
| NordVPN | 78 | 0.6% |
| Cloudflare WARP | 71 | 0.6% |
| PulseProxy VPN | 35 | 0.3% |
| Best Proxy Switcher | 12 | 0.1% |
The Cloudflare WARP appearance is mildly amusing — 71 attackers routed through Cloudflare’s own consumer VPN service to attack a Cloudflare-protected site. WARP runs on a wide variety of clients (mobile, desktop, server), so this finding describes an interesting routing choice without implying anything about the underlying device population.
One additional player worth flagging is AS401401 “Unredacted Inc” with 91 IPs (top route 23.191.200.0/24) — a US-based privacy infrastructure provider that runs Tor-adjacent services (Snowflake bridges, anti-censorship relays). ipinfo did not flag these as Tor exits, but they belong to the same broader anti-censorship infrastructure ecosystem.
Geographic distribution (by request volume)
| Country | Share |
|---|---|
| T1 (Tor) | 39.72% |
| US | 33.76% |
| SG | 7.13% |
| JP | 3.65% |
| TH | 3.19% |
| KR | 2.87% |
| VN | 1.66% |
161 countries appear in total. Russia, Belarus, and Iran are essentially absent from the attack traffic.
The user-agent giveaway
Of 1,373 distinct user-agent strings, five account for 94% of all requests, distributed in near-equal chunks:
| User agent | Requests |
|---|---|
Mozilla/5.0 (Windows NT 10.0; Win64; x64) ... Chrome/140.0.0.0 Safari/537.36 | 55,430,456 |
... Chrome/142.0.0.0 ... | 55,164,529 |
... Chrome/143.0.0.0 ... | 54,686,813 |
... Chrome/144.0.0.0 ... | 54,481,810 |
... Chrome/141.0.0.0 ... | 53,856,207 |
Real browser populations have a long tail centred on the current stable version. Here, five consecutive Chrome majors on Windows each deliver ~54-55M requests within a ±1.5% band. As the per-IP analysis above showed, individual bots rotate between two or three of these UAs randomly — confirming this is a generator iterating a list, not real browsers.
The Firefox-Android tail (versions 109-146 each contributing ~80K mobile requests) is the same trick at a smaller scale, and impossible versions like Chrome 147 and 148 appear in small numbers — signs of a UA-randomizer that doesn’t know what releases actually exist.
Technical interpretation
This section restates the framing from the Summary section with the underlying technical detail. There is some overlap by design — the goal is to let a technical reader see exactly which observations support each part of the plain-language interpretation above.
It was an L7 volumetric flood. Almost exclusively GET requests against two bare HTML paths, with no probing of expensive endpoints, no path enumeration, no credential stuffing, no protocol abuse, no amplification. The goal was to overwhelm origin capacity by raw request volume. (The data covers only the attack window; whether the operator scanned the site before the flood began is outside the available scope.)
It was a single coordinated campaign, not a coincidence of multiple stressers or multiple buyers. Per-IP behaviour is identical across Tor exits, US bulk hosting, and Asian cloud providers — same UA rotation logic, same protocol stack, same cadence.
…but with internal fleet structure. A small asymmetry in target URLs hints at how the campaign was organised: every request to the bare root “/” (3.7% of attack volume, ~11M requests) came from non-Tor infrastructure. The Tor exit pool targeted “/ru/” exclusively. Combined with the mild per-fleet UA-mix variations (Stiftung Erneuerbare Freiheit leaning on Chrome/141, Siamdata on Chrome/142), this is consistent with the same operator running multiple worker pools with slightly different task configurations across infrastructure types.
Challenge-solving capability is in the bot software, not in a sub-fleet. The 8.5M managed_challenge_bypassed requests are not “requests that slipped past detection” — they were challenged, and they passed. The bots can execute Cloudflare’s JavaScript challenge and present the right token, then proceed as legitimate clients. This requires either headless-browser-grade rendering, a specifically-engineered Cloudflare challenge solver, or paid solver services integrated into the bot software. The per-ASN solver-rate pattern (QuickPacket 0%, residential ISPs 8-12%, Tor exits and second-tier clouds 2-5%) is best explained by Cloudflare’s per-source trust score gating who gets challenged at all — the QuickPacket /24s appear to be rule-blocked by l7ddos before ever reaching the challenge stage, while traffic from more-trusted ASNs is allowed to attempt the challenge. The bot software is presumably the same across sources; what varies is whether Cloudflare gives it the opportunity to try.
It wasn’t customised to this target specifically. No vulnerability discovery, no API targeting, no path enumeration against pozirk.online’s actual content structure. The bot software’s capabilities (challenge-solving, UA randomisation, TLS 1.3) appear pre-built rather than adapted in flight: nothing changed across nine hours of failed mitigation.
The defense outcome was strong but not perfect. Cloudflare’s l7ddos and custom firewall rules handled 93% of the attack with 403 challenges, returning Cloudflare’s challenge page rather than touching origin. The challenge-solving cohort produced a sustained ~218K requests per 15-min on origin, with origin returning 502 throughout — meaning origin was overwhelmed but not down (median origin response time 146 ms before failure). After roughly the first 30–45 minutes (during which 23 successful 200s leaked through, see “The 23 successful responses” above), no further attacker request received a 200 for the remaining ~8.5 hours.
The operator profile. Mixed Tor + bulk-hoster sourcing, large Tor share by request volume, sophisticated UA synthesis with per-bot randomisation, a coordinated fleet of ~1,500 disciplined workers running modern HTTP/2 + TLS 1.3, and — most distinguishing — a ~3% cohort capable of solving Cloudflare’s managed challenges automatically. That last capability puts this above the script-kiddie booter level: it requires real engineering and either licensed solver infrastructure or a custom headless-browser implementation. Still below state-grade APT in adaptiveness (no in-the-moment evasion, no target-specific recon) but the challenge-solving cohort is the kind of tooling typically associated with paid commercial DDoS-for-hire services targeting WAF-protected sites, not free booters.
Quick reference
| Metric | Value |
|---|---|
| Client requests (attack volume) | 283.3M |
| GraphQL total events (includes 6.8M Early Hints) | 290,080,608 |
| Attack share of host client traffic | 99.80% |
| Bandwidth | 1.29 TB |
| Peak rate (1-min, dashboard-derived) | ~4.9M req/min |
| Sustained rate (15-min) | ~600K req/min (~10K req/s) |
| Per-IP sustained rate | ~6.4 req/s |
| Active IPs per 15-min window | ~1,500 |
| Cumulative distinct IPs | 12,314 |
| Distinct ASNs | 3,053 |
| Distinct countries | 161 |
| Distinct user agents | 1,373 |
Successful origin responses (200) | 23 (12 benign in 20:30–21:00 MSK, 11 likely challenge-passed in 21:00–21:15 MSK; none after) |
Cloudflare l7ddos rule share | 84.9% (246.4M requests) |
| Cloudflare custom firewall share | 8.1% (23.4M requests) |
| Challenge-solving cohort (passed managed challenge, hit origin → 502) | 2.9% (8.5M requests, steady 2.3–3.4% throughout) |
| Tor share | 39.72% |
| Top non-Tor ASN (QuickPacket, LLC) share | 33.6% |
| Top-5 UA share | ~94% |
| Reconnaissance traffic during attack window (host-wide) | ~9,000 requests |