Prepared by: RESIDENT.NGO ThreatLab
Detection Date: January 12, 2026
Incident Period: January 12-13, 2026
Classification: Distributed Denial of Service (DDoS) Attack – Layer 7 (HTTP Flood)
Publication Date: January 19, 2025
RESIDENT.NGO helped mitigate a significant 12-hour DDoS attack involving a botnet of approximately 245,000 unique IP addresses targeting https://investigatebel.org/, the website of the Belarusian Investigative Center – an independent Belarusian investigative journalism outlet that exposes corruption, debunks disinformation, and produces in-depth analytical reporting as part of a global network of investigative media. The report ends with practical technical recommendations that can be shared with specialists to address similar DDoS attacks.
Data Methodology Note
This analysis is based on curated malicious traffic data extracted from Cloudflare analytics. The dataset includes only confirmed malicious requests that meet the following criteria: almost all IPs were hitting only one single URL GET /en/investigations/politik-moshennik-i-biznesmen-kto-iz-belarusov-pryatal-dengi-v-shvejcarskom-banke
The actual attack volume included lower-frequency requests and other techniques like the using of random query strings and hitting other URLs like “/” were also used in parallel. But in this dataset and article we decided to focus on the botnet infrastructure that was used to hit one specific URL to reduce noise, possible mistakes and make the report more readable. As a result of this filtering approach, the dataset is considered to contain exclusively malicious traffic, with legitimate user activity effectively excluded.
Executive Summary
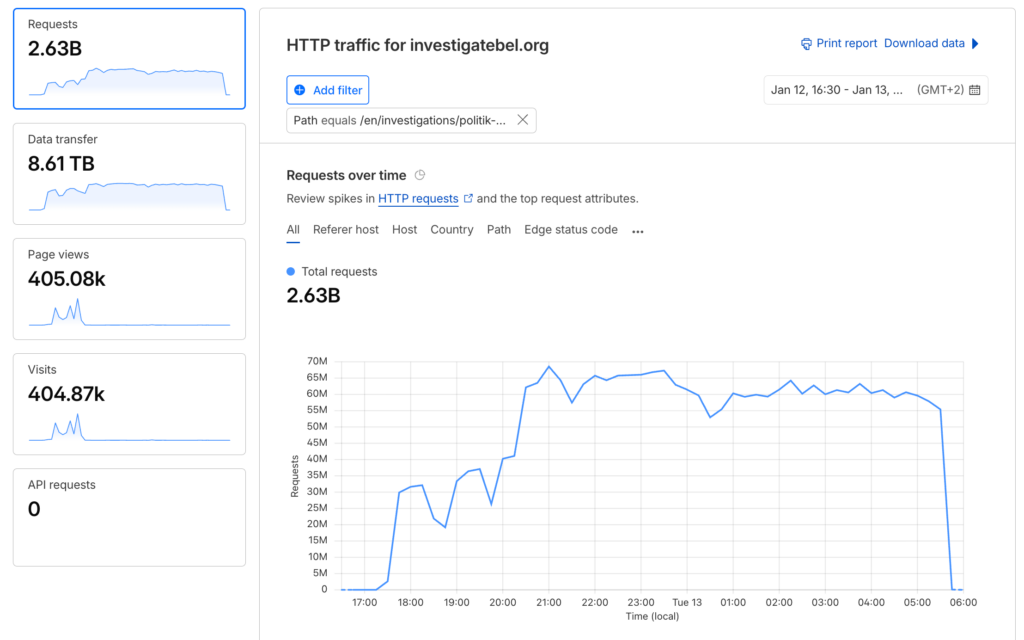
On January 12, 2026, at 15:45:00 UTC, investigatebel.org experienced a massive distributed denial-of-service attack targeting a specific investigative journalism article that was published in 2023 about Belarusian politicians and businessmen allegedly hiding money in Swiss banks with “GET /en/investigations/politik-moshennik-i-biznesmen-kto-iz-belarusov-pryatal-dengi-v-shvejcarskom-banke” requests. The attack persisted for approximately 12 hours, concluding on January 13, 2026, at 04:00:00 UTC.
Key Metrics (Curated Malicious Traffic Only)
- Confirmed Malicious Requests: 2,629,704,138 (2.6+ billion).
Average Request Rate: ~59.6 million requests/hour - Attack Duration: 12 hours, 15 minutes (over 12 hours)
- Peak Traffic: Sustained throughout the entire duration
- Massive botnet: 245,078 unique IP addresses spanning 10,676 ASNs
- Real source IPs: Layer 7 HTTP attacks cannot easily spoof source IPs (TCP handshake required); these are genuine compromised/controlled endpoints
- Unique ASNs: 10,676 autonomous systems
- Geographic Span: 201 countries
- Mitigation Success Rate: 97.3% (requests blocked or rate-limited)
- Uniform traffic patterns: the same user agents and operating systems evenly distributed across requests.
- Partial Managed Challenge bypass
Despite extensive automated mitigation and “Under attack” mode enabled, a portion of the attack traffic reached the origin server, requiring direct intervention by RESIDENT.NGO specialists to stabilize the service and mitigate the impact of the sustained Layer 7 attack.
Botnet Analysis
Scale & Distribution
This attack demonstrates the characteristics of a massive, globally distributed botnet:
- Botnet Size: 245,078 compromised/controlled endpoints (minimum)
- Network Diversity: 10,676 unique ASNs involved (spanning residential, commercial, datacenter, and mobile networks)
- Geographic Distribution: 201 countries, indicating truly global infrastructure
- Per-IP Request Volume: Average ~10,715 requests per IP (relatively low per-endpoint, suggesting distributed load)
The extreme diversity in both IP addresses and ASNs is consistent with:
- Large-scale IoT botnet (compromised routers, cameras, DVRs, smart devices)
- Residential proxy network or botnet-for-hire service
- Compromised residential computers and servers across multiple continents
- Mobile device botnet (given significant mobile user agent presence)
Top Source IPs
The highest-volume individual sources contributed relatively modest request volumes, further confirming distributed botnet behavior:
| Rank | IP Address | Requests | % of Total |
|---|---|---|---|
| 1 | 109.224.1.158 | 139,545 | 0.0053% |
| 2 | 24.144.237.246 | 114,127 | 0.0043% |
| 3 | 66.78.130.5 | 107,891 | 0.0041% |
| 4 | 198.232.115.102 | 105,363 | 0.0040% |
| 5 | 104.174.225.190 | 101,834 | 0.0039% |
| 6 | 207.172.185.41 | 100,317 | 0.0038% |
| 7 | 177.242.0.85 | 95,621 | 0.0036% |
| 8 | 162.155.70.199 | 95,520 | 0.0036% |
| 9 | 71.57.241.165 | 93,857 | 0.0036% |
| 10 | 216.55.252.75 | 92,866 | 0.0035% |
Analysis: No single IP contributed more than 0.006% of total traffic, indicating high distribution and coordinated attack behavior typical of professional botnets. The relatively even distribution suggests load balancing across the botnet infrastructure.
We analyzed top 199,000 IP addresses with IPinfo.io summarization service and can see that 17.8% of analyzed IPs are VPN services, 13.9% are mobile network IPs and 2.0% are classified as proxies:
Summary
| Metric | Count | Approximate Percentage |
|---|---|---|
| Total | 199,000 | 100.0% |
| Unique | 199,000 | 100.0% |
| Anycast | 0 | 0.0% |
| Bogon | 2 | 0.0% |
| Mobile | 27,706 | 13.9% |
| VPN | 35,368 | 17.8% |
| Proxy | 20 | 0.0% |
| Hosting | 3,999 | 2.0% |
| Tor | 0 | 0.0% |
| Relay | 13 | 0.0% |
Top Usage Types
| Usage Type | Count | Percentage |
|---|---|---|
| ISP | 187,004 | 94.0% |
| Business | 6,502 | 3.3% |
| Hosting | 2,901 | 1.5% |
| Education | 94 | 0.0% |
| Government | 23 | 0.0% |
Top Privacy Services
| Service | Count | Percentage |
|---|---|---|
| NordVPN | 531 | 0.3% |
| Surfshark | 132 | 0.1% |
| FastVPN | 34 | 0.0% |
| IPVanish | 30 | 0.0% |
| ProtonVPN | 25 | 0.0% |
Geographic Analysis
Global Distribution
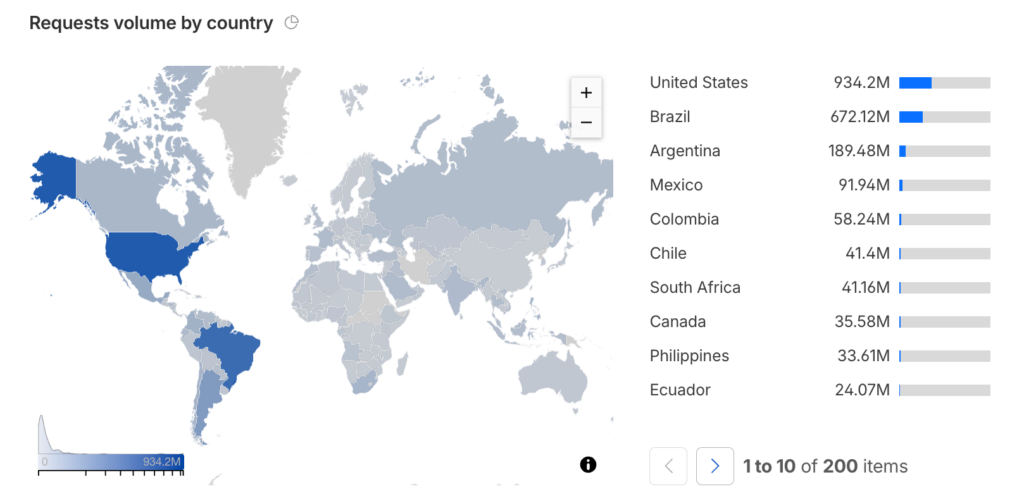
Attack traffic originated from 201 countries worldwide, with heavy concentration in the Americas region:
| Rank | Country | Requests | % of Total |
|---|---|---|---|
| 1 | United States (US) | 933,801,109 | 35.5% |
| 2 | Brazil (BR) | 671,190,328 | 25.5% |
| 3 | Argentina (AR) | 189,319,472 | 7.2% |
| 4 | Mexico (MX) | 91,857,141 | 3.5% |
| 5 | Colombia (CO) | 58,126,815 | 2.2% |
| 6 | Chile (CL) | 41,381,331 | 1.6% |
| 7 | South Africa (ZA) | 41,108,772 | 1.6% |
| 8 | Canada (CA) | 35,542,558 | 1.4% |
| 9 | Philippines (PH) | 33,562,276 | 1.3% |
| 10 | Ecuador (EC) | 24,041,581 | 0.9% |
| 11 | India (IN) | 23,778,294 | 0.9% |
| 12 | France (FR) | 22,056,918 | 0.8% |
| 13 | Saudi Arabia (SA) | 21,978,088 | 0.8% |
| 14 | Thailand (TH) | 19,036,451 | 0.7% |
| 15 | Russia (RU) | 18,226,156 | 0.7% |
| 16 | Venezuela (VE) | 17,750,962 | 0.7% |
| 17 | Honduras (HN) | 16,982,533 | 0.6% |
| 18 | Indonesia (ID) | 16,899,174 | 0.6% |
| 19 | Turkey (TR) | 16,715,486 | 0.6% |
| 20 | Iraq (IQ) | 15,729,663 | 0.6% |
| 21 | Morocco (MA) | 15,414,994 | 0.6% |
| 22 | Ukraine (UA) | 14,710,513 | 0.6% |
| 23 | Malaysia (MY) | 13,026,894 | 0.5% |
| 24 | United Kingdom (GB) | 12,497,846 | 0.5% |
| 25 | Vietnam (VN) | 12,379,642 | 0.5% |
Regional Concentration
- Americas (North & South America): ~68% of total traffic
- United States + Brazil alone: 61% of all attack traffic
- Europe: ~5%
- Asia-Pacific: ~7%
- Middle East & Africa: ~4%
- Other/Distributed: ~16%
Network Infrastructure Analysis
Autonomous System Numbers (ASNs)
The attack leveraged 10,676 unique autonomous systems, indicating extremely broad network diversity. ASN numbers as provided by Cloudflare and ASN names obtained from Team Cymru whois service. Top 50 ASNs by request volume:
| Rank | ASN | Organization | Country | Requests | % of Total |
|---|---|---|---|---|---|
| 1 | AS7922 | COMCAST-7922 | US | 145,485,775 | 5.5% |
| 2 | AS7018 | ATT-INTERNET4 | US | 137,342,303 | 5.2% |
| 3 | AS20001 | TWC-20001-PACWEST | US | 113,839,079 | 4.3% |
| 4 | AS28573 | Claro NXT Telecomunicacoes Ltda | BR | 67,190,161 | 2.6% |
| 5 | AS20115 | CHARTER-20115 | US | 59,830,568 | 2.3% |
| 6 | AS22927 | Telefonica de Argentina | AR | 56,336,956 | 2.1% |
| 7 | AS8151 | UNINET | MX | 46,123,747 | 1.8% |
| 8 | AS22773 | ASN-CXA-ALL-CCI-22773-RDC | US | 43,367,808 | 1.6% |
| 9 | AS10796 | TWC-10796-MIDWEST | US | 40,550,075 | 1.5% |
| 10 | AS21928 | T-MOBILE-AS21928 | US | 36,359,781 | 1.4% |
| 11 | AS7303 | Telecom Argentina S.A. | AR | 36,050,424 | 1.4% |
| 12 | AS14593 | SPACEX-STARLINK | US | 34,553,536 | 1.3% |
| 13 | AS8167 | V tal | BR | 32,648,950 | 1.2% |
| 14 | AS701 | UUNET | US | 32,631,969 | 1.2% |
| 15 | AS26599 | TELEFONICA BRASIL S.A | BR | 28,081,365 | 1.1% |
| 16 | AS27699 | TELEFONICA BRASIL S.A | BR | 28,030,409 | 1.1% |
| 17 | AS11664 | Techtel LMDS Comunicaciones Interactivas S.A. | AR | 24,543,649 | 0.9% |
| 18 | AS7738 | V tal | BR | 20,611,496 | 0.8% |
| 19 | AS27747 | Telecentro S.A. | AR | 20,100,206 | 0.8% |
| 20 | AS33363 | BHN-33363 | US | 20,094,217 | 0.8% |
| 21 | AS17072 | TOTAL PLAY TELECOMUNICACIONES SA DE CV | MX | 20,088,038 | 0.8% |
| 22 | AS28343 | UNIFIQUE TELECOMUNICACOES SA | BR | 17,766,749 | 0.7% |
| 23 | AS27884 | CABLECOLOR S.A. | HN | 14,836,931 | 0.6% |
| 24 | AS6128 | CABLE-NET-1 | US | 14,713,461 | 0.6% |
| 25 | AS10620 | Telmex Colombia S.A. | CO | 14,300,179 | 0.5% |
| 26 | AS13999 | Mega Cable, S.A. de C.V. | MX | 13,682,404 | 0.5% |
| 27 | AS9299 | IPG-AS-AP Philippine Long Distance Telephone Company | PH | 13,515,010 | 0.5% |
| 28 | AS11426 | TWC-11426-CAROLINAS | US | 13,439,592 | 0.5% |
| 29 | AS28649 | Desktop Sigmanet Comunicacao Multimidia SA | BR | 12,946,460 | 0.5% |
| 30 | AS18881 | TELEFONICA BRASIL S.A | BR | 12,727,941 | 0.5% |
| 31 | AS25019 | SAUDINETSTC-AS | SA | 12,393,222 | 0.5% |
| 32 | AS12322 | PROXAD | FR | 11,434,493 | 0.4% |
| 33 | AS3816 | COLOMBIA TELECOMUNICACIONES S.A. ESP BIC | CO | 11,055,024 | 0.4% |
| 34 | AS11351 | TWC-11351-NORTHEAST | US | 10,607,252 | 0.4% |
| 35 | AS6167 | CELLCO-PART | US | 10,144,194 | 0.4% |
| 36 | AS27901 | Pacifico Cable SPA. | CL | 9,986,301 | 0.4% |
| 37 | AS55836 | RELIANCEJIO-IN Reliance Jio Infocomm Limited | IN | 9,970,068 | 0.4% |
| 38 | AS11427 | TWC-11427-TEXAS | US | 9,785,307 | 0.4% |
| 39 | AS7418 | TELEFONICA CHILE S.A. | CL | 9,522,758 | 0.4% |
| 40 | AS27651 | ENTEL CHILE S.A. | CL | 9,021,942 | 0.3% |
| 41 | AS27947 | Telconet S.A | EC | 8,945,853 | 0.3% |
| 42 | AS5650 | FRONTIER-FRTR | US | 8,639,683 | 0.3% |
| 43 | AS28210 | GIGA MAIS FIBRA TELECOMUNICACOES S.A. | BR | 8,603,574 | 0.3% |
| 44 | AS9121 | TTNET | TR | 8,377,719 | 0.3% |
| 45 | AS36903 | MT-MPLS | MA | 8,347,005 | 0.3% |
| 46 | AS4788 | TTSSB-MY TM TECHNOLOGY SERVICES SDN. BHD. | MY | 7,755,974 | 0.3% |
| 47 | AS7029 | WINDSTREAM | US | 7,645,139 | 0.3% |
| 48 | AS53006 | ALGAR TELECOM SA | BR | 7,327,654 | 0.3% |
| 49 | AS577 | BACOM | CA | 7,230,190 | 0.3% |
| 50 | AS17639 | CONVERGE-AS Converge ICT Solutions Inc. | PH | 7,198,492 | 0.3% |
Attack Vectors & Traffic Signatures
User Agents (Complete List – 16 Total)
The attack employed exactly 16 distinct user agent strings, all mimicking Google Chrome browsers across different platforms. The distribution shows suspicious uniformity:
| # | User Agent | Requests | % of Total |
|---|---|---|---|
| 1 | Mozilla/5.0 (X11; Linux x86_64) AppleWebKit/537.36 (KHTML, like Gecko) Chrome/133.0.0.0 Safari/537.36 | 168,671,261 | 6.4% |
| 2 | Mozilla/5.0 (X11; Linux x86_64) AppleWebKit/537.36 (KHTML, like Gecko) Chrome/135.0.0.0 Safari/537.36 | 167,881,550 | 6.4% |
| 3 | Mozilla/5.0 (X11; Linux x86_64) AppleWebKit/537.36 (KHTML, like Gecko) Chrome/132.0.0.0 Safari/537.36 | 167,251,655 | 6.4% |
| 4 | Mozilla/5.0 (X11; Linux x86_64) AppleWebKit/537.36 (KHTML, like Gecko) Chrome/134.0.0.0 Safari/537.36 | 166,347,161 | 6.3% |
| 5 | Mozilla/5.0 (Macintosh; Intel Mac OS X 10_15_7) AppleWebKit/537.36 (KHTML, like Gecko) Chrome/132.0.0.0 Safari/537.36 | 166,392,739 | 6.3% |
| 6 | Mozilla/5.0 (Windows NT 10.0; Win64; x64) AppleWebKit/537.36 (KHTML, like Gecko) Chrome/133.0.0.0 Safari/537.36 | 165,670,215 | 6.3% |
| 7 | Mozilla/5.0 (Macintosh; Intel Mac OS X 10_15_7) AppleWebKit/537.36 (KHTML, like Gecko) Chrome/134.0.0.0 Safari/537.36 | 164,211,845 | 6.2% |
| 8 | Mozilla/5.0 (Linux; Android 10; K) AppleWebKit/537.36 (KHTML, like Gecko) Chrome/134.0.0.0 Mobile Safari/537.36 | 164,786,703 | 6.3% |
| 9 | Mozilla/5.0 (Windows NT 10.0; Win64; x64) AppleWebKit/537.36 (KHTML, like Gecko) Chrome/135.0.0.0 Safari/537.36 | 163,744,244 | 6.2% |
| 10 | Mozilla/5.0 (Macintosh; Intel Mac OS X 10_15_7) AppleWebKit/537.36 (KHTML, like Gecko) Chrome/133.0.0.0 Safari/537.36 | 163,057,395 | 6.2% |
| 11 | Mozilla/5.0 (Linux; Android 10; K) AppleWebKit/537.36 (KHTML, like Gecko) Chrome/133.0.0.0 Mobile Safari/537.36 | 163,246,835 | 6.2% |
| 12 | Mozilla/5.0 (Windows NT 10.0; Win64; x64) AppleWebKit/537.36 (KHTML, like Gecko) Chrome/134.0.0.0 Safari/537.36 | 161,806,169 | 6.2% |
| 13 | Mozilla/5.0 (Macintosh; Intel Mac OS X 10_15_7) AppleWebKit/537.36 (KHTML, like Gecko) Chrome/135.0.0.0 Safari/537.36 | 161,742,020 | 6.2% |
| 14 | Mozilla/5.0 (Linux; Android 10; K) AppleWebKit/537.36 (KHTML, like Gecko) Chrome/132.0.0.0 Mobile Safari/537.36 | 162,767,734 | 6.2% |
| 15 | Mozilla/5.0 (Linux; Android 10; K) AppleWebKit/537.36 (KHTML, like Gecko) Chrome/135.0.0.0 Mobile Safari/537.36 | 159,867,034 | 6.1% |
| 16 | Mozilla/5.0 (Windows NT 10.0; Win64; x64) AppleWebKit/537.36 (KHTML, like Gecko) Chrome/132.0.0.0 Safari/537.36 | 162,259,578 | 6.2% |
Chrome Version Distribution:
- Chrome 132: ~25% (652,471,706 requests)
- Chrome 133: ~25% (660,645,706 requests)
- Chrome 134: ~25% (657,152,878 requests)
- Chrome 135: ~25% (653,235,348 requests)
Platform Distribution (from User Agents):
- Linux (X11): 4 variants, ~670M requests
- Windows (NT 10.0): 4 variants, ~653M requests
- macOS (10_15_7): 4 variants, ~655M requests
- Android (10): 4 variants, ~651M requests
Analysis: The nearly perfect 25% distribution across Chrome versions 132-135 is statistically impossible in legitimate traffic and confirms these user agents are systematically rotated by the botnet software. Each platform (Linux/Windows/macOS/Android) has exactly 4 user agents (one per Chrome version), indicating deliberate programmatic generation.
Browser Distribution (Complete)
| Browser | Requests | % of Total |
|---|---|---|
| Chrome | 1,979,035,832 | 75.2% |
| ChromeMobile | 650,668,306 | 24.8% |
The exclusive use of Chrome-based user agents (no Firefox, Safari, Edge, etc.) further confirms automated attack traffic with limited user agent diversity.
Operating System Distribution (Complete)
| Operating System | Requests | % of Total |
|---|---|---|
| Linux | 670,151,627 | 25.5% |
| macOS (Mac OS X) | 655,403,999 | 24.9% |
| Windows | 653,480,206 | 24.9% |
| Android | 650,668,306 | 24.7% |
Analysis: Perfect 25% distribution across all four major operating systems is artificial and impossible in real-world web traffic. Legitimate traffic typically shows 60-80% Windows dominance. This uniform distribution is a signature of programmatically generated attack traffic with systematic OS rotation.
Device Type Distribution (Complete)
| Device Type | Requests | % of Total |
|---|---|---|
| Desktop | 1,979,035,832 | 75.2% |
| Mobile | 650,668,306 | 24.8% |
HTTP Referers (Complete List – 102 Total)
The attack included exactly 102 distinct HTTP referer values. All spoofed referers show highly uniform request counts (~18.5 million each):
| # | Referer | Requests |
|---|---|---|
| 1 | https://www.reddit.com/ | 18,578,207 |
| 2 | https://www.twitch.tv/ | 18,540,167 |
| 3 | https://www.memrise.com/ | 18,528,188 |
| 4 | https://www.stackoverflow.com/ | 18,526,015 |
| 5 | https://www.codecademy.com/ | 18,521,340 |
| 6 | https://www.medium.com/ | 18,520,961 |
| 7 | https://www.office.com/ | 18,520,837 |
| 8 | https://www.amazon.com/ | 18,520,423 |
| 9 | https://www.khanacademy.org/ | 18,520,084 |
| 10 | https://www.flickr.com/ | 18,517,280 |
| 11 | https://www.udemy.com/ | 18,517,267 |
| 12 | https://www.live.com/ | 18,516,253 |
| 13 | https://www.last.fm/ | 18,516,006 |
| 14 | https://www.dribbble.com/ | 18,512,700 |
| 15 | https://www.apple.com/ | 18,504,987 |
| 16 | https://www.wikipedia.org/ | 18,504,368 |
| 17 | https://www.freecodecamp.org/ | 18,501,835 |
| 18 | https://www.discord.com/ | 18,496,416 |
| 19 | https://www.github.com/ | 18,489,620 |
| 20 | https://www.busuu.com/ | 18,489,096 |
| 21 | https://www.blogger.com/ | 18,488,794 |
| 22 | https://www.slack.com/ | 18,487,781 |
| 23 | https://www.w3schools.com/ | 18,487,641 |
| 24 | https://www.spotify.com/ | 18,487,315 |
| 25 | https://www.soundcloud.com/ | 18,484,626 |
| 26 | https://www.pinterest.com/ | 18,478,988 |
| 27 | https://www.youtube.com/ | 18,478,678 |
| 28 | https://www.vimeo.com/ | 18,476,122 |
| 29 | https://www.microsoft.com/ | 18,475,644 |
| 30 | https://www.yahoo.com/ | 18,471,959 |
| 31 | https://www.genius.com/ | 18,471,908 |
| 32 | https://www.skillshare.com/ | 18,471,689 |
| 33 | https://www.deviantart.com/ | 18,471,277 |
| 34 | https://www.behance.net/ | 18,465,803 |
| 35 | https://www.duolingo.com/ | 18,462,841 |
| 36 | https://www.wordpress.com/ | 18,461,360 |
| 37 | https://www.google.com/ | 18,457,769 |
| 38 | https://www.coursera.org/ | 18,457,521 |
| 39 | https://www.quora.com/ | 18,456,643 |
| 40 | https://www.udacity.com/ | 18,454,660 |
| 41 | https://www.twitter.com/ | 18,452,838 |
| 42 | https://www.netflix.com/ | 18,448,279 |
| 43 | https://www.imgur.com/ | 18,442,699 |
| 44 | https://www.tiktok.com/ | 18,438,763 |
| 45 | https://www.linkedin.com/ | 18,438,524 |
| 46 | https://www.ebay.com/ | 18,436,198 |
| 47 | https://www.bing.com/ | 18,434,292 |
| 48 | https://www.tumblr.com/ | 18,432,171 |
| 49 | https://www.facebook.com/ | 18,431,340 |
| 50 | https://www.lingoda.com/ | 18,421,654 |
| 51 | https://www.instagram.com/ | 18,419,972 |
| 52 | https://www.mixcloud.com/ | 18,418,991 |
| 53 | https://www.babbel.com/ | 18,415,576 |
| 54 | https://www.adobe.com/ | 18,374,227 |
| 55 | https://www.masterclass.com/ | 18,360,514 |
| 56 | https://www.cnbc.com/ | 18,355,930 |
| 57 | https://www.notion.so/ | 18,352,938 |
| 58 | https://www.expedia.com/ | 18,346,967 |
| 59 | https://www.zillow.com/ | 18,345,208 |
| 60 | https://www.buzzfeed.com/ | 18,344,292 |
| 61 | https://www.squarespace.com/ | 18,343,433 |
| 62 | https://www.canva.com/ | 18,343,212 |
| 63 | https://www.foxnews.com/ | 18,342,413 |
| 64 | https://www.accuweather.com/ | 18,341,757 |
| 65 | https://www.ubereats.com/ | 18,336,969 |
| 66 | https://www.paypal.com/ | 18,335,851 |
| 67 | https://www.walmart.com/ | 18,332,215 |
| 68 | https://www.strava.com/ | 18,331,011 |
| 69 | https://www.airbnb.com/ | 18,330,468 |
| 70 | https://www.fitbit.com/ | 18,328,427 |
| 71 | https://www.figma.com/ | 18,326,084 |
| 72 | https://www.lyft.com/ | 18,325,915 |
| 73 | https://www.doordash.com/ | 18,323,767 |
| 74 | https://www.nbcnews.com/ | 18,321,216 |
| 75 | https://www.nytimes.com/ | 18,320,371 |
| 76 | https://www.asana.com/ | 18,319,055 |
| 77 | https://www.myfitnesspal.com/ | 18,317,427 |
| 78 | https://www.trello.com/ | 18,317,240 |
| 79 | https://www.zoom.us/ | 18,316,600 |
| 80 | https://www.realtor.com/ | 18,315,348 |
| 81 | https://www.forbes.com/ | 18,315,019 |
| 82 | https://www.yelp.com/ | 18,313,267 |
| 83 | https://www.dropbox.com/ | 18,312,685 |
| 84 | https://www.tripadvisor.com/ | 18,306,272 |
| 85 | https://www.webflow.com/ | 18,304,013 |
| 86 | https://www.target.com/ | 18,301,646 |
| 87 | https://www.washingtonpost.com/ | 18,298,960 |
| 88 | https://www.wix.com/ | 18,298,252 |
| 89 | https://www.grubhub.com/ | 18,295,006 |
| 90 | https://www.bbc.com/ | 18,293,791 |
| 91 | https://www.aliexpress.com/ | 18,290,888 |
| 92 | https://www.etsy.com/ | 18,282,680 |
| 93 | https://www.uber.com/ | 18,279,957 |
| 94 | https://www.booking.com/ | 18,275,884 |
| 95 | https://www.huffpost.com/ | 18,267,541 |
| 96 | https://www.bloomberg.com/ | 18,266,357 |
| 97 | https://www.weather.com/ | 18,264,613 |
| 98 | https://www.cnn.com/ | 18,263,489 |
| 99 | https://www.theguardian.com/ | 18,262,050 |
| 100 | https://www.shopify.com/ | 18,225,494 |
| 101 | https://www.rosetta.com/ | 167,686 |
| 102 | https://investigatebel.org/en/investigations/politik-moshennik-i-biznesmen-kto-iz-belarusov-pryatal-dengi-v-shvejcarskom-banke | 4,074 |
| – | (Empty/No Referer) | 789,343,293 |
Total with referers: 1,821,782,638 requests
No referer (empty): 789,343,293 requests (43.4% of malicious traffic)
Mitigation Effectiveness
Mitigation Analysis
- Total Blocked/Rate-Limited: 2,583,811,824 requests (97.3%)
- Backend Errors: 44,396,954 requests (1.7%) – Traffic reached backend but failed
- Origin Responses (200 OK): 404,326 requests (0.015%)
Origin Impact Assessment
Despite Cloudflare’s edge blocking, 44,801,280 requests reached the origin server. This represents an average request rate of 1015 requests/second over the 12 hour attack period. While this appears modest, these requests were issued to dynamic page and were sufficient to disrupt normal website operations.
Managed Challenge Bypass
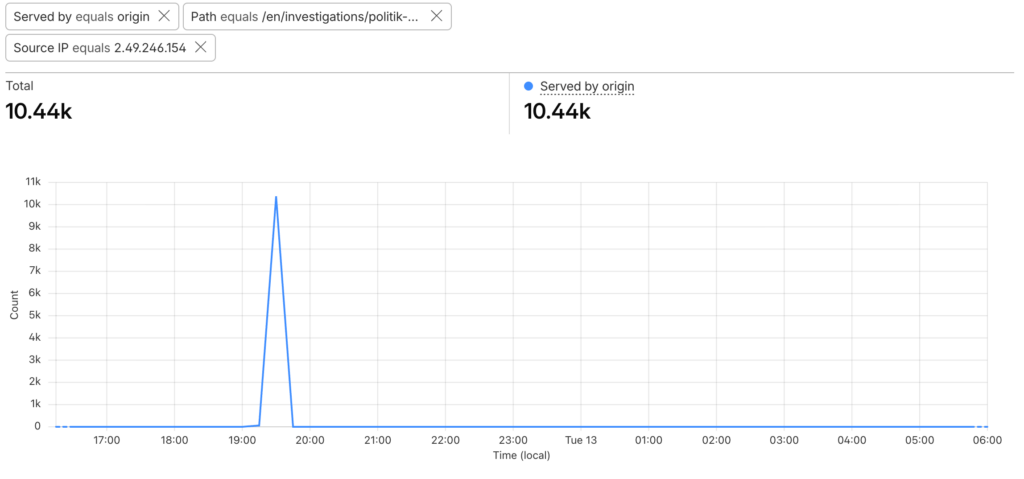
Some sophisticated bots successfully bypassed Cloudflare’s “Managed Challenge” – the default challenge type when “Under Attack” mode is enabled. Analysis of origin-level logs identified specific IPs that passed challenge validation:
- IP 2.49.246.154: Successfully sent 10,440 requests to the origin server
- Additional IPs demonstrated similar challenge-passing capabilities
This indicates the botnet included headless browser automation or challenge-solving capabilities, allowing a subset of attack traffic to reach the origin despite active protection measures.
Mitigation Adjustments
During the attack, RESIDENT.NGO specialists made real-time adjustments to both Cloudflare protection rules and origin server configurations to mitigate the DDoS impact. For security reasons, the exact configurations cannot be disclosed, as doing so could help future attackers bypass these defenses.
In such situations, we recommend reducing the Challenge Passage duration and switching from Managed Challenge to Interactive Challenge. It is important to note that clients who previously passed a non-interactive challenge and received a valid cookie will not be challenged again after switching to Interactive Challenge. Their earlier, less secure challenge result remains valid for the duration of the configured Challenge Passage period.
We also configured rate-limiting rules to ensure that IP addresses generating an excessive number of requests were blocked for an appropriate period of time. In addition, we enabled caching for dynamic pages at Cloudflare’s edge and ensured that stale content could be served even if the origin server became slow or unresponsive.
Cloudflare Galileo Project
The organization benefited from Cloudflare’s Galileo Project, which provides free DDoS protection to at-risk public interest organizations, including independent media and investigative journalism outlets. Without this protection and the Business Plan features provided at no cost to eligible Galileo participants – the attack would have been significantly harder to mitigate.
Attribution
Threat Actor Profile
Based on the observed attack behavior and execution patterns, the activity is attributed to a highly capable and well-resourced threat actor. The operation exhibited professional-grade coordination, systematic request generation, and the use of a Layer 7 HTTP attack, indicating deliberate planning and technical sophistication beyond opportunistic or low-effort attacks.
The scale, consistency, and resource requirements are most consistent with the use of a commercial botnet-for-hire service, or infrastructure operated by a well-funded private or state-aligned entity. Potential actors include state-affiliated groups connected to Belarusian or Russian interests, as well as private entities seeking to suppress or retaliate against investigative reporting.
The pronounced concentration of attack traffic originating from Latin America, particularly Brazil and Argentina, strongly supports the hypothesis of commercial botnet rental rather than direct use of state-controlled infrastructure.
MITRE ATT&CK Enterprise Classification
| ID | Tactic | Description |
|---|---|---|
| T1499 | Impact | Endpoint Denial of Service: The adversary attempts to make the web service unavailable by exhausting application resources. |
| T1499.003 | Impact | Application Exhaustion Flood: High-volume HTTP/HTTPS requests overwhelm the application at Layer 7. |
| T1071 | Command and Control | Application Layer Protocol: Standard web protocols (HTTP/HTTPS) are abused to deliver malicious traffic. |
Technical Indicators of Compromise (IoCs)
IoC Distribution
Full IoC dataset available:
- 245,078 confirmed malicious IP addresses
- Sorted by request volume (highest threat first)
- Ready for import to MISP, SIEM, firewall blocklists
Recommendations
In case you expect a DDoS attack, it is very important to prepare in advance:
- Set up a reliable DDoS mitigation service like Cloudflare.
- Activate a proper plan there that allows you to enable advanced mitigation options – apply to Project Galileo if eligible.
- Enable rate limiting rules on Cloudflare.
- Enable caching rules on Cloudflare. Make sure that your pages are cached and served stale in case your origin is not available.
- Enable rate limiting rules on your origin server.
- Enable caching on your origin server.
- Enable caching on application level.
- Tweak HTTPS configuration of your webserver to reuse TLS sessions that were already established between the origin server and Cloudflare to reduce CPU load.
- Make sure that your origin server IP is not exposed and adversaries can’t attack it directly bypassing DDoS mitigation infrastructure. If it was already exposed, change the IP address and make sure that new IP is not revealed.
Every website and setup is different, and every project has its own limitations, thus, the recommendations provided above may or may not fit your current setup. If you need help with setting up DDoS mitigation or you are under attack, feel free to contact RESIDENT.NGO at [email protected].